Install Prometheus for Gitlab
Page content
Prometheus is an open-source monitoring system with a built-in noSQL time-series database. It offers a multi-dimensional data model, a flexible query language, and diverse visualization possibilities. Prometheus collects metrics from http nedpoint. Most service dind’t have this endpoint so you need optional programs that generate additional metrics cald exporters.
Install prometheus from package
curl -s https://packagecloud.io/install/repositories/prometheus-rpm/release/script.rpm.sh | sudo bash

yum install prometheus2 alertmanager -y
Configurate Prometheus
nano /etc/prometheus/promethsu.yml
---
global:
  scrape_interval: 15s
  scrape_timeout: 15s
  evaluation_interval: 15s

alerting:
  alertmanagers:
  - static_configs:
    - targets:
       - localhost:9095

rule_files:
  - "/etc/prometheus/alert.rules"

scrape_configs:
- job_name: prometheus
  static_configs:
  - targets:
    - localhost:9090
- job_name: redis
  static_configs:
  - targets:
    - localhost:9121
- job_name: postgres
  static_configs:
  - targets:
    - localhost:9187
- job_name: node
  static_configs:
  - targets:
    - localhost:9100
- job_name: gitlab-workhorse
  static_configs:
  - targets:
    - localhost:9229
- job_name: gitlab-unicorn
  metrics_path: "/-/metrics"
  static_configs:
  - targets:
    - 127.0.0.1:8080
- job_name: gitlab-sidekiq
  static_configs:
  - targets:
    - 127.0.0.1:8082
- job_name: gitlab_monitor_database
  metrics_path: "/database"
  static_configs:
  - targets:
    - localhost:9168
- job_name: gitlab_monitor_sidekiq
  metrics_path: "/sidekiq"
  static_configs:
  - targets:
    - localhost:9168
- job_name: gitlab_monitor_process
  metrics_path: "/process"
  static_configs:
  - targets:
    - localhost:9168
- job_name: gitaly
  static_configs:
  - targets:
    - localhost:9236
- job_name: nginx
  static_configs:
  - targets:
    - localhost:9913
- job_name: 'playframework-app'
  scrape_interval: 5s
  metrics_path: '/metrics'
  static_configs:
  - targets: ['localhost:9000']
nano /etc/prometheus/alert.rules
groups:
- name: host
  rules:
  - alert: low_connected_users
    expr: play_current_users < 2
    for: 30s
    labels:
      severity: slack
    annotations:
      summary: "Instance {{ $labels.instance }} under lower load"
      description: "{{ $labels.instance }} of job {{ $labels.job }} is under lower load."
nano /etc/prometheus/alertmanager.yml
global:
templates:
- '/etc/prometheus/template/*.tmpl'
route:
group_by: [alertname, job]
# If an alert isn't caught by a route, send it to slack.
receiver: slack_general
routes:
- match:
severity: slack
receiver: slack_general
receivers:
- name: slack_general
slack_configs:
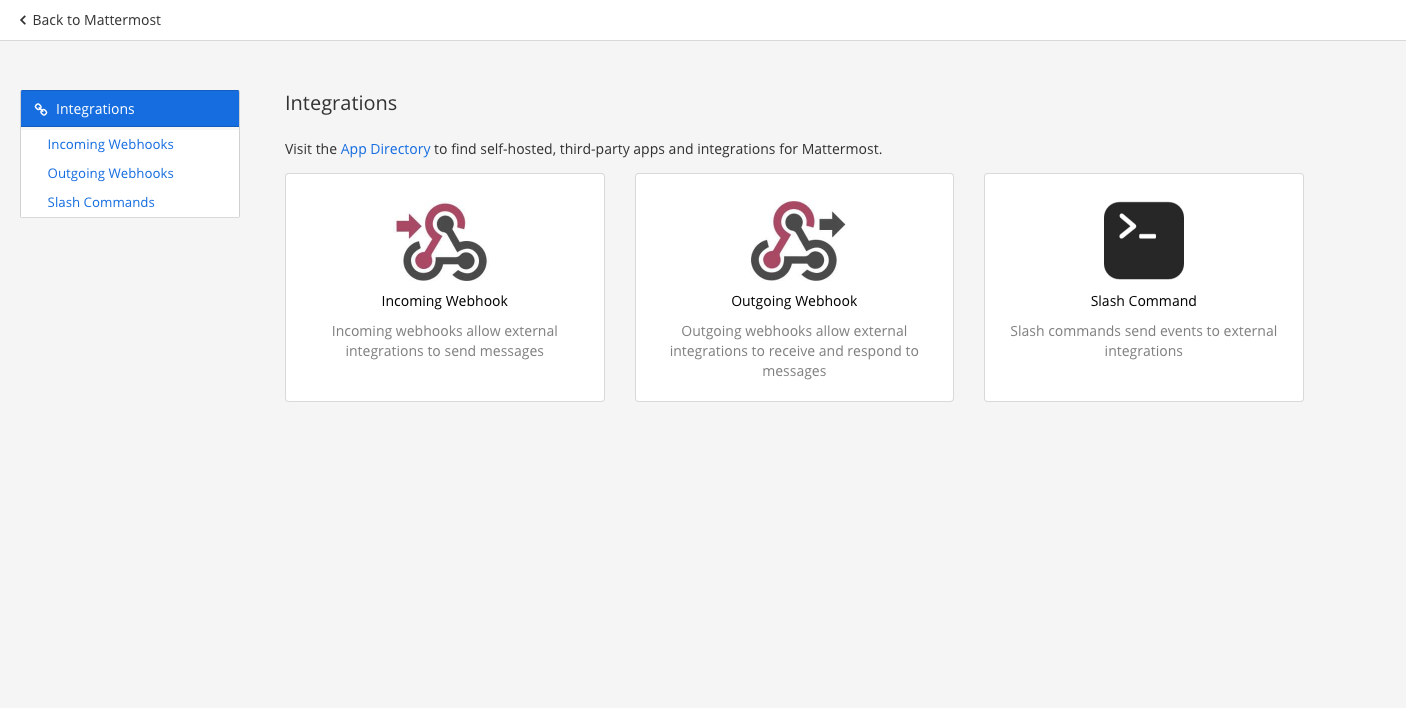
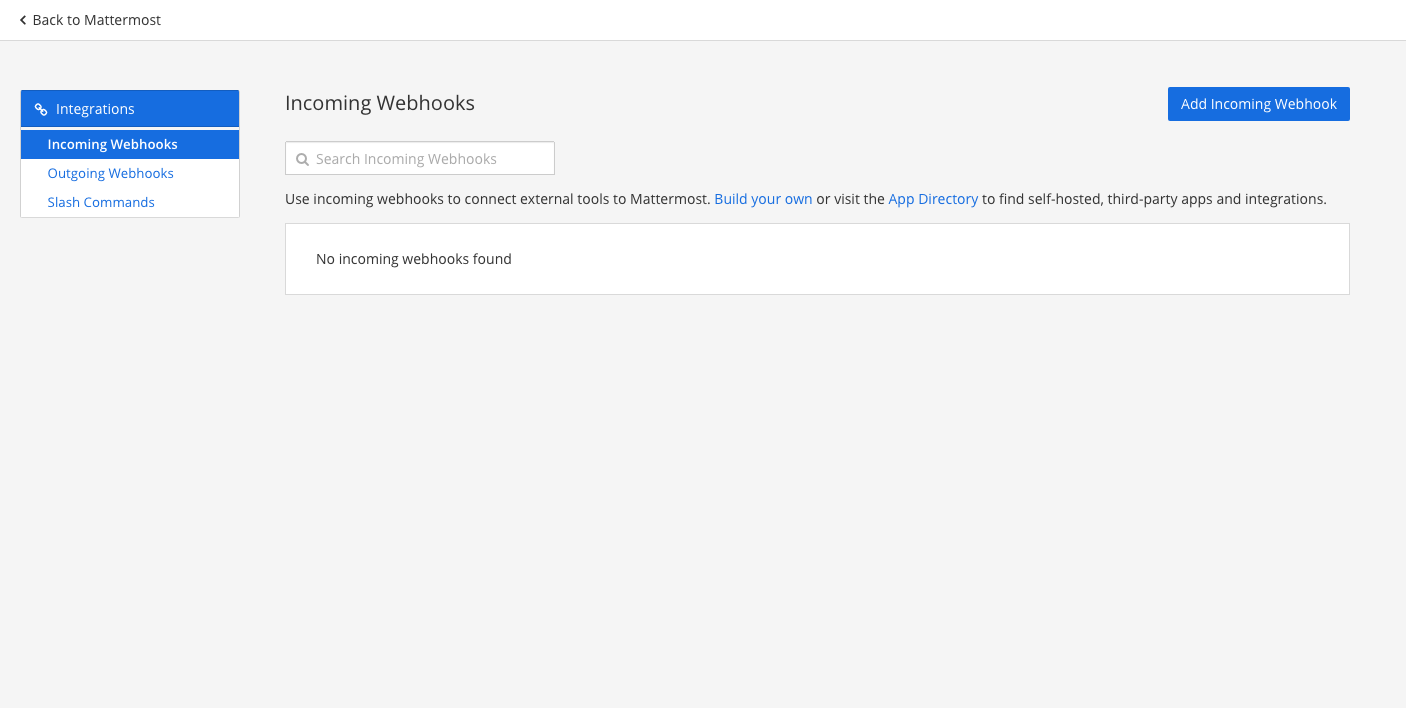
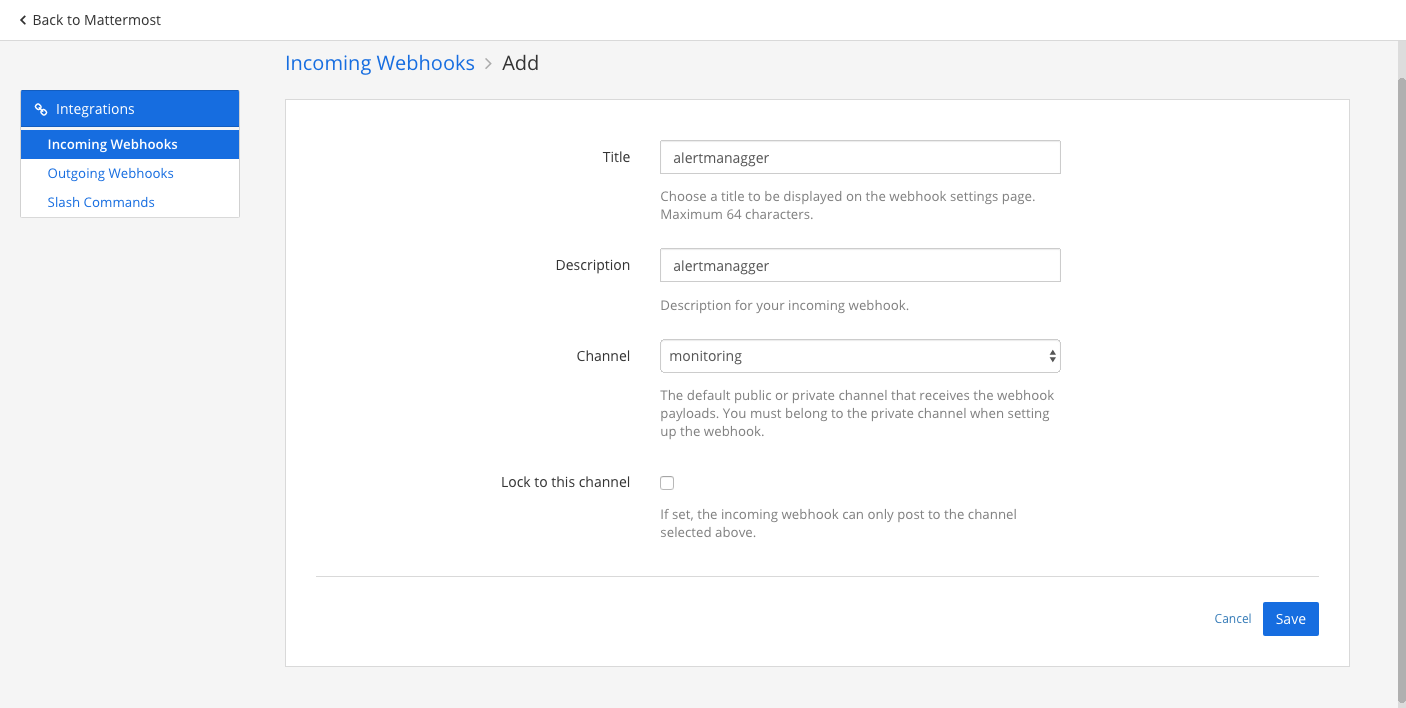
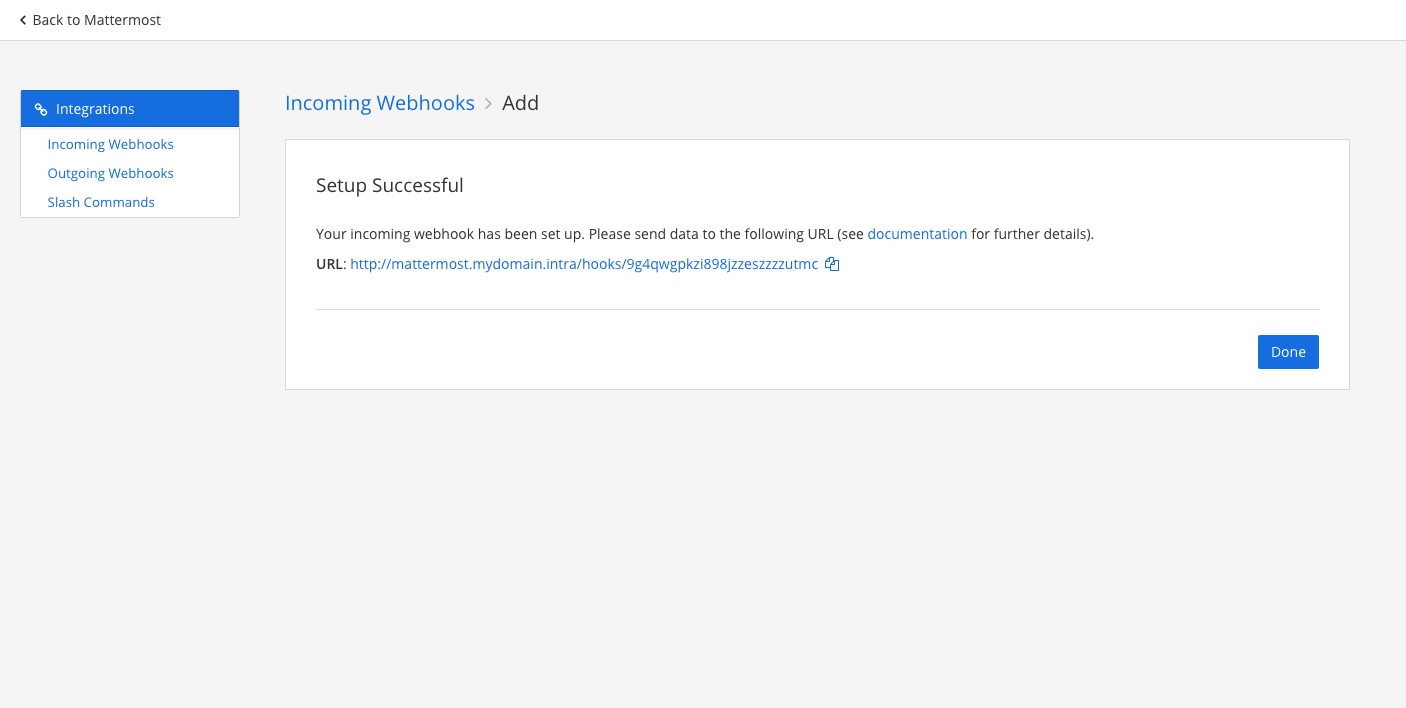
- api_url: http://mattermost.devopstales.intra/hooks/9g4qwgpkzi898jzzeszzzzutmc
channel: 'monitoring'
username: "prometheus" #name ins mattermost
text: ""
send_resolved: true
mkdir /etc/prometheus/template/
nano /etc/prometheus/template/alertmessage.tmpl
{{ define "__slack_text" }}
{{ range .Alerts }}{{ .Annotations.description}}{{ end }}
{{ end }}

{{ define "__slack_title" }}
{{ range .Alerts }} :scream: {{ .Annotations.summary}} :scream: {{ end }}
{{ end }}

{{ define "slack.default.text" }}{{ template "__slack_text" . }}{{ end }}
{{ define "slack.default.title" }}{{ template "__slack_title" . }}{{ end }}
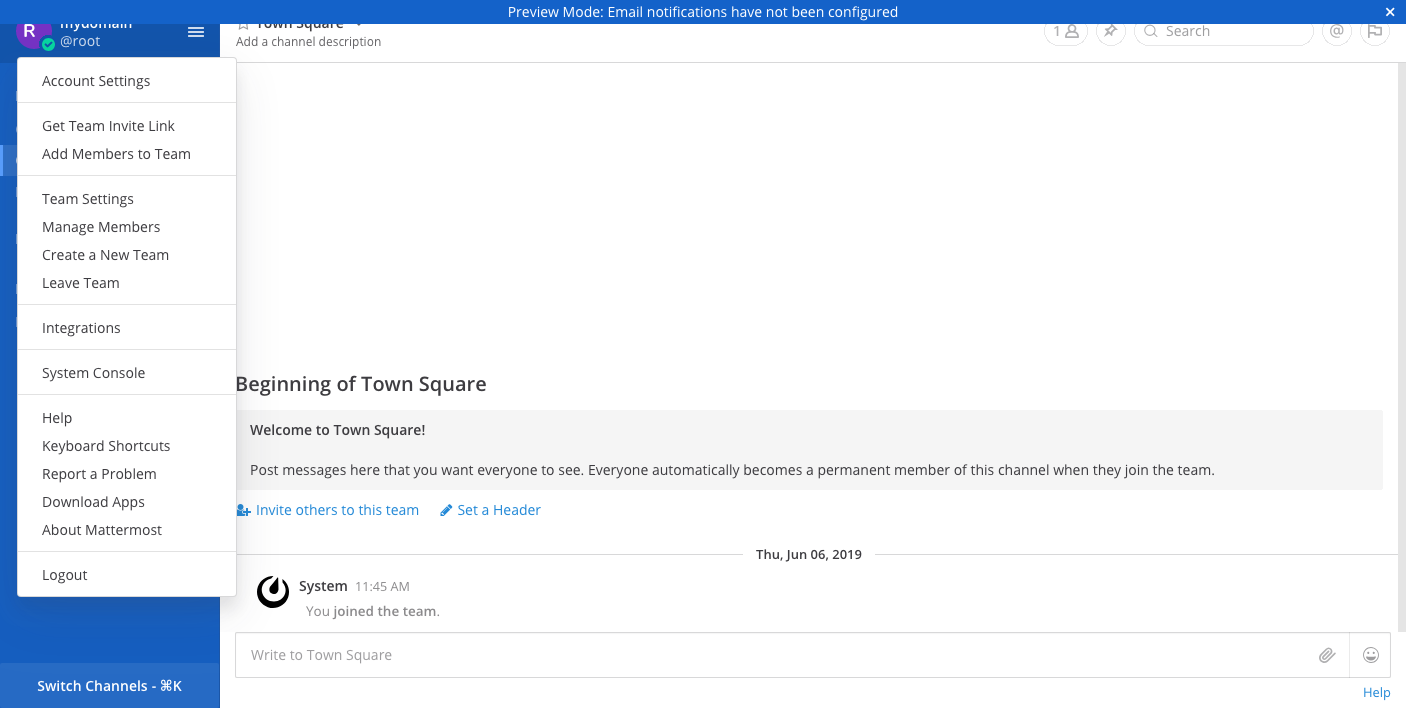
Configurate Gitlab
nano /etc/gitlab/gitlab.rb
alertmanager['enable'] = false
prometheus['enable'] = false
node_exporter['enable'] = true
redis_exporter['enable'] = true
postgres_exporter['enable'] = true
gitlab_monitor['enable'] = true

gitlab-ctl reconfigure

systemctl start alertmanager.service
systemctl status alertmanager.service
systemctl start prometheus.service
systemctl status prometheus.service