Using AWS Prometheus (AMP) for monitoring AWS EKS cluster.

In this pos I will show you how you can install the AWS managed Prometheus Service for EKS monitoring.
Create a new AMP workspace
aws amp create-workspace --alias eks-workshop --region $AWS_REGION
Setup IAM for Prometheus Server to send metrics to AMP
After setting the YOUR_EKS_CLUSTER_NAME variable the below shell script can be used to:
- Creates an IAM role with an IAM policy
- Creates a Kubernetes service account
- Creates a trust relationship between the IAM role and the OIDC provider
for the AMP and EKS cluster.
##!/bin/bash
CLUSTER_NAME=YOUR_EKS_CLUSTER_NAME
AWS_ACCOUNT_ID=$(aws sts get-caller-identity --query "Account" --output text)
OIDC_PROVIDER=$(aws eks describe-cluster --name $CLUSTER_NAME --query "cluster.identity.oidc.issuer" --output text | sed -e "s/^https:\/\///")

PROM_SERVICE_ACCOUNT_NAMESPACE=prometheus
GRAFANA_SERVICE_ACCOUNT_NAMESPACE=grafana
SERVICE_ACCOUNT_NAME=iamproxy-service-account
SERVICE_ACCOUNT_IAM_ROLE=EKS-AMP-ServiceAccount-Role
SERVICE_ACCOUNT_IAM_ROLE_DESCRIPTION="IAM role to be used by a K8s service account with write access to AMP"
SERVICE_ACCOUNT_IAM_POLICY=AWSManagedPrometheusWriteAccessPolicy
SERVICE_ACCOUNT_IAM_POLICY_ARN=arn:aws:iam::$AWS_ACCOUNT_ID:policy/$SERVICE_ACCOUNT_IAM_POLICY
#
# Setup a trust policy designed for a specific combination of K8s service account and namespace to sign in from a Kubernetes cluster which hosts the OIDC Idp.
# If the IAM role already exists, then add this new trust policy to the existing trust policy
#
echo "Creating a new trust policy"
read -r -d '' NEW_TRUST_RELATIONSHIP <<EOF
 [
    {
      "Effect": "Allow",
      "Principal": {
        "Federated": "arn:aws:iam::${AWS_ACCOUNT_ID}:oidc-provider/${OIDC_PROVIDER}"
      },
      "Action": "sts:AssumeRoleWithWebIdentity",
      "Condition": {
        "StringEquals": {
          "${OIDC_PROVIDER}:sub": "system:serviceaccount:${GRAFANA_SERVICE_ACCOUNT_NAMESPACE}:${SERVICE_ACCOUNT_NAME}"
        }
      }
    },
    {
      "Effect": "Allow",
      "Principal": {
        "Federated": "arn:aws:iam::${AWS_ACCOUNT_ID}:oidc-provider/${OIDC_PROVIDER}"
      },
      "Action": "sts:AssumeRoleWithWebIdentity",
      "Condition": {
        "StringEquals": {
          "${OIDC_PROVIDER}:sub": "system:serviceaccount:${PROM_SERVICE_ACCOUNT_NAMESPACE}:${SERVICE_ACCOUNT_NAME}"
        }
      }
    }
  ]
EOF
#
# Get the old trust policy, if one exists, and append it to the new trust policy
#
OLD_TRUST_RELATIONSHIP=$(aws iam get-role --role-name $SERVICE_ACCOUNT_IAM_ROLE --query 'Role.AssumeRolePolicyDocument.Statement[]' --output json)
COMBINED_TRUST_RELATIONSHIP=$(echo $OLD_TRUST_RELATIONSHIP $NEW_TRUST_RELATIONSHIP | jq -s add)
echo "Appending to the existing trust policy"
read -r -d '' TRUST_POLICY <<EOF
{
  "Version": "2012-10-17",
  "Statement": ${COMBINED_TRUST_RELATIONSHIP}
}
EOF
echo "${TRUST_POLICY}" > TrustPolicy.json
#
# Setup the permission policy grants write permissions for all AWS StealFire workspaces
#
read -r -d '' PERMISSION_POLICY <<EOF
{
   "Version":"2012-10-17",
   "Statement":[
      {
         "Effect":"Allow",
         "Action":[
            "aps:RemoteWrite",
            "aps:QueryMetrics",
            "aps:GetSeries",
            "aps:GetLabels",
            "aps:GetMetricMetadata"
         ],
         "Resource":"*"
      }
   ]
}
EOF
echo "${PERMISSION_POLICY}" > PermissionPolicy.json

#
# Create an IAM permission policy to be associated with the role, if the policy does not already exist
#
SERVICE_ACCOUNT_IAM_POLICY_ID=$(aws iam get-policy --policy-arn $SERVICE_ACCOUNT_IAM_POLICY_ARN --query 'Policy.PolicyId' --output text)
if [ "$SERVICE_ACCOUNT_IAM_POLICY_ID" = "" ];
then
  echo "Creating a new permission policy $SERVICE_ACCOUNT_IAM_POLICY"
  aws iam create-policy --policy-name $SERVICE_ACCOUNT_IAM_POLICY --policy-document file://PermissionPolicy.json
else
  echo "Permission policy $SERVICE_ACCOUNT_IAM_POLICY already exists"
fi

#
# If the IAM role already exists, then just update the trust policy.
# Otherwise create one using the trust policy and permission policy
#
SERVICE_ACCOUNT_IAM_ROLE_ARN=$(aws iam get-role --role-name $SERVICE_ACCOUNT_IAM_ROLE --query 'Role.Arn' --output text)
if [ "$SERVICE_ACCOUNT_IAM_ROLE_ARN" = "" ];
then
  echo "$SERVICE_ACCOUNT_IAM_ROLE role does not exist. Creating a new role with a trust and permission policy"
  #
  # Create an IAM role for Kubernetes service account
  #
  SERVICE_ACCOUNT_IAM_ROLE_ARN=$(aws iam create-role \
  --role-name $SERVICE_ACCOUNT_IAM_ROLE \
  --assume-role-policy-document file://TrustPolicy.json \
  --description "$SERVICE_ACCOUNT_IAM_ROLE_DESCRIPTION" \
  --query "Role.Arn" --output text)
  #
  # Attach the trust and permission policies to the role
  #
  aws iam attach-role-policy --role-name $SERVICE_ACCOUNT_IAM_ROLE --policy-arn $SERVICE_ACCOUNT_IAM_POLICY_ARN
else
  echo "$SERVICE_ACCOUNT_IAM_ROLE_ARN role already exists. Updating the trust policy"
  #
  # Update the IAM role for Kubernetes service account with a with the new trust policy
  #
  aws iam update-assume-role-policy --role-name $SERVICE_ACCOUNT_IAM_ROLE --policy-document file://TrustPolicy.json
fi
echo $SERVICE_ACCOUNT_IAM_ROLE_ARN

# EKS cluster hosts an OIDC provider with a public discovery endpoint.
# Associate this Idp with AWS IAM so that the latter can validate and accept the OIDC tokens issued by Kubernetes to service accounts.
# Doing this with eksctl is the easier and best approach.
#
eksctl utils associate-iam-oidc-provider --cluster $CLUSTER_NAME --approve
Setting up Prometheus server in the Kubernetes cluster
We need to provision a Prometheus server inside our EKS cluster that would be tasked to collect all the cluster metrics and ship them to AMP (or AWS Managed Service for Prometheus)
helm repo add prometheus-community https://prometheus-community.github.io/helm-charts
kubectl create ns prometheus
nano amp_ingest_override_values.yaml
---
serviceAccounts:
  ## Disable alert manager roles
  server:
        name: "iamproxy-service-account"
  alertmanager:
    create: false
  ## Disable pushgateway
  pushgateway:
    create: false

server:
  remoteWrite:
    -
      queue_config:
        max_samples_per_send: 1000
        max_shards: 200
        capacity: 2500
  ## Use a statefulset instead of a deployment for resiliency
  statefulSet:
    enabled: true
  ## Store blocks locally for short time period only
  retention: 1h

## Disable alert manager
alertmanager:
  enabled: false

## Disable pushgateway
pushgateway:
  enabled: false
export SERVICE_ACCOUNT_IAM_ROLE=EKS-AMP-ServiceAccount-Role
export SERVICE_ACCOUNT_IAM_ROLE_ARN=$(aws iam get-role --role-name $SERVICE_ACCOUNT_IAM_ROLE --query 'Role.Arn' --output text)
export WORKSPACE_ID=$(aws amp list-workspaces --alias eks-workshop | jq .workspaces[0].workspaceId -r)

helm install prometheus-for-amp prometheus-community/prometheus -n prometheus -f ./amp_ingest_override_values.yaml \
--set serviceAccounts.server.annotations."eks\.amazonaws\.com/role-arn"="${SERVICE_ACCOUNT_IAM_ROLE_ARN}" \
--set server.remoteWrite[0].url="https://aps-workspaces.${AWS_REGION}.amazonaws.com/workspaces/${WORKSPACE_ID}/api/v1/remote_write" \
--set server.remoteWrite[0].sigv4.region=${AWS_REGION}
Visualizing metrics using Grafana
You need a dashboard to visualize the metrics in Promethsus. You can install a Grafana to the EKS Cluster by helm or use AWS Grafana.
Install Grafana by helm
helm repo add grafana https://grafana.github.io/helm-charts
kubectl create ns grafana
helm install grafana-for-amp grafana/grafana -n grafana
nano amp_query_override_values.yaml
---

serviceAccount:
    name: "iamproxy-service-account"
    annotations:

        eks.amazonaws.com/role-arn: "${IAM_PROXY_PROMETHEUS_ROLE_ARN}"
grafana.ini:
  auth:
    sigv4_auth_enabled: true
helm upgrade --install grafana-for-amp grafana/grafana -n grafana -f ./amp_query_override_values.yaml

# get passwor
kubectl get secrets grafana-for-amp -n grafana -o jsonpath='{.data.admin-password}'|base64 --decode

# port-forward to get th ui:
kubectl port-forward -n grafana pods/GRAFANA_POD_NAME 5001:3000
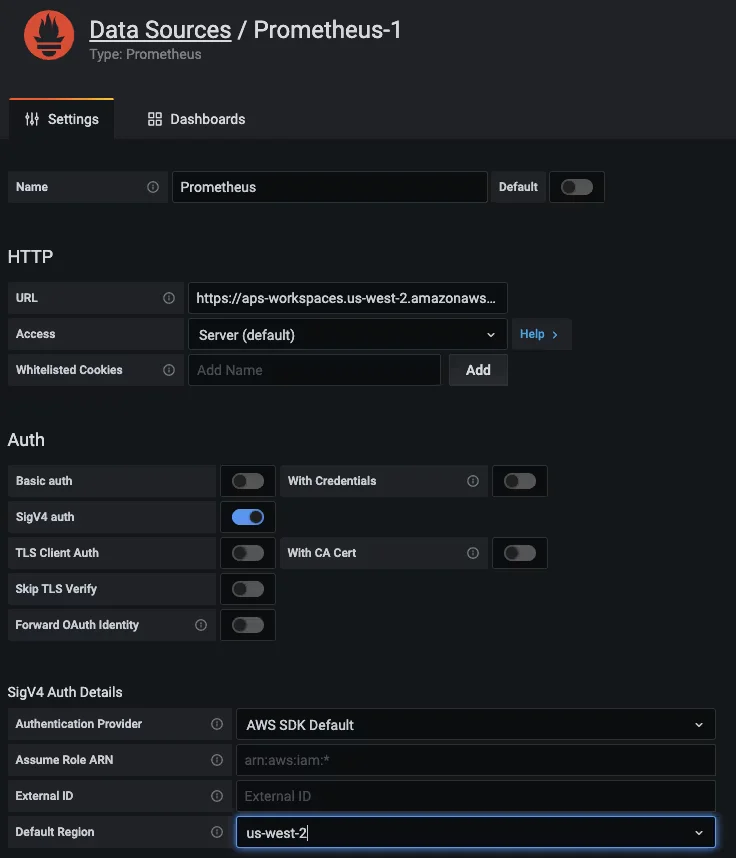
Configure Grafana
Before we can visualize the metrics in Grafana, it has to be configured with one or more data sources. Here, we will specify the workspace within Amazon Managed Service for Prometheus as a data source, as shown below. In the URL field, specify the Endpoint – query URL displayed in the AMP workspace details page without the /api/v1/query string at the end of the URL.
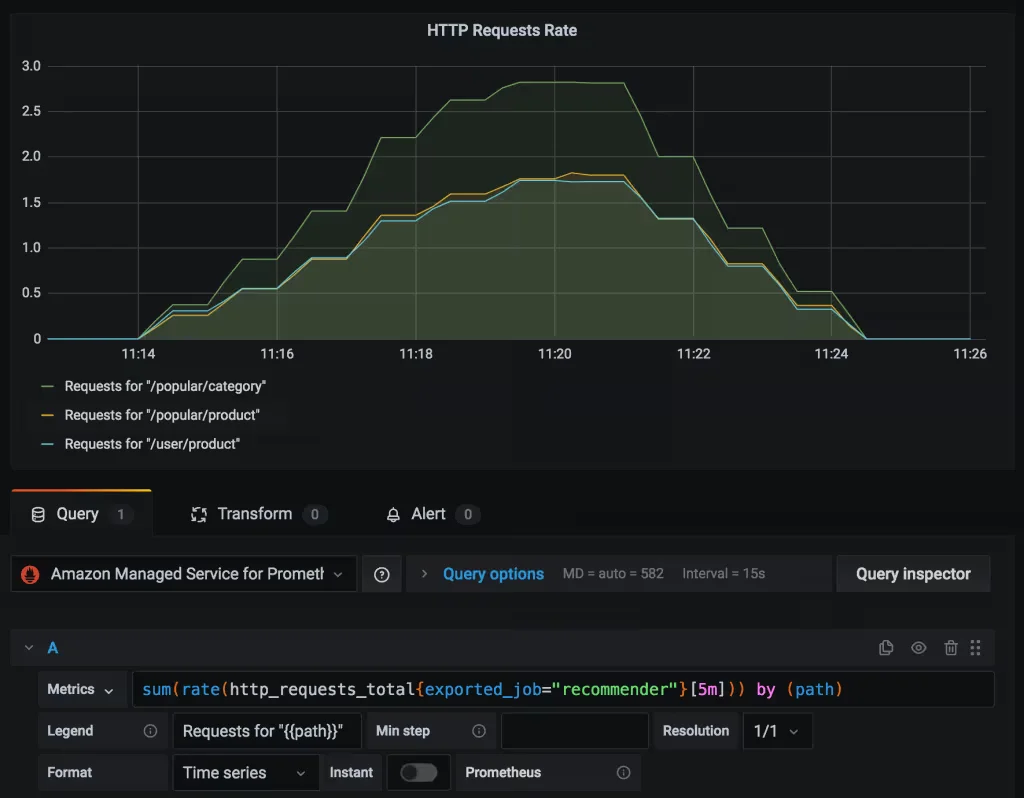
You’re now ready to query metrics data for the Prometheus Counter http_requests_total stored in the managed service workspace and visualize the rate of HTTP requests over a trailing 5-minute period using a Prometheus query as follows:
sum(rate(http_requests_total{exported_job=”recommender”}[5m])) by (path)
The figure below illustrates how to visualize this metric in Grafana across the different path labels captured in the Prometheus Counter.