Send pfSense Logs to Wazuh

Centralizing pfSense firewall logs in Wazuh SIEM provides critical security visibility and threat detection capabilities. This updated guide for 2026 covers pfSense 2.7.x/2.8.x and Wazuh 4.8+ with proper syslog formatting and decoder configuration.
Architecture Overview
┌─────────────┐    ┌─────────────┐    ┌─────────────┐    ┌─────────────┐
│   pfSense   │◄──►│  syslog-ng  │◄──►│   Wazuh     │◄──►│  Elastic/   │
│   Firewall  │    │   (plugin)  │    │   Manager   │    │  OpenSearch │
└─────────────┘    └─────────────┘    └─────────────┘    └─────────────┘
     RFC5424              TCP/UDP           Rules/          Dashboards
    Syslog               5514/udp         Decoders
Why Not Wazuh Agent on pfSense?
Since pfSense 2.5+, installing the Wazuh agent directly on pfSense is not recommended:
- ⚠️ Breaks the pfSense upgrade manager UI
- ⚠️ Can cause package conflicts with FreeBSD base
- ⚠️ Limited agent functionality on FreeBSD
- ⚠️ May impact firewall performance
Recommended approach: Forward logs via syslog to Wazuh Manager.
The Syslog Format Challenge
The Problem
pfSense 2.5+ supports both RFC5424 and RFC3164 syslog formats:
| Format | Issue |
|---|---|
| RFC5424 | Wazuh decoders expect RFC3164 format |
| RFC3164 (native) | FreeBSD syslogd omits hostname field |
Without proper hostname in syslog messages, Wazuh’s default pfSense decoders fail to parse logs correctly.
The Solution
Use the syslog-ng package on pfSense to properly format and forward logs to Wazuh.
Step 1: Install syslog-ng Package
Navigate to Package Manager
- Log into pfSense web interface
- Go to System → Package Manager → Available Packages
- Search for
syslog-ng

- Click Install next to syslog-ng
- Wait for installation to complete
Verify Installation
# SSH to pfSense or use console
pkg info | grep syslog-ng
Step 2: Configure syslog-ng
Access syslog-ng Settings
Navigate to Services → syslog-ng → Settings tab
Configure the following:
| Setting | Value |
|---|---|
| Enable syslog-ng | ✓ Checked |
| High Priority | ✓ Checked (ensures syslog-ng handles logs) |
| Log Level | Info or Warning (based on your needs) |
| Capture DNS Resolver Logs | ✓ Checked |
| Capture DHCP Logs | ✓ Checked |
| Capture Filter Logs | ✓ Checked |
| Capture System Logs | ✓ Checked |
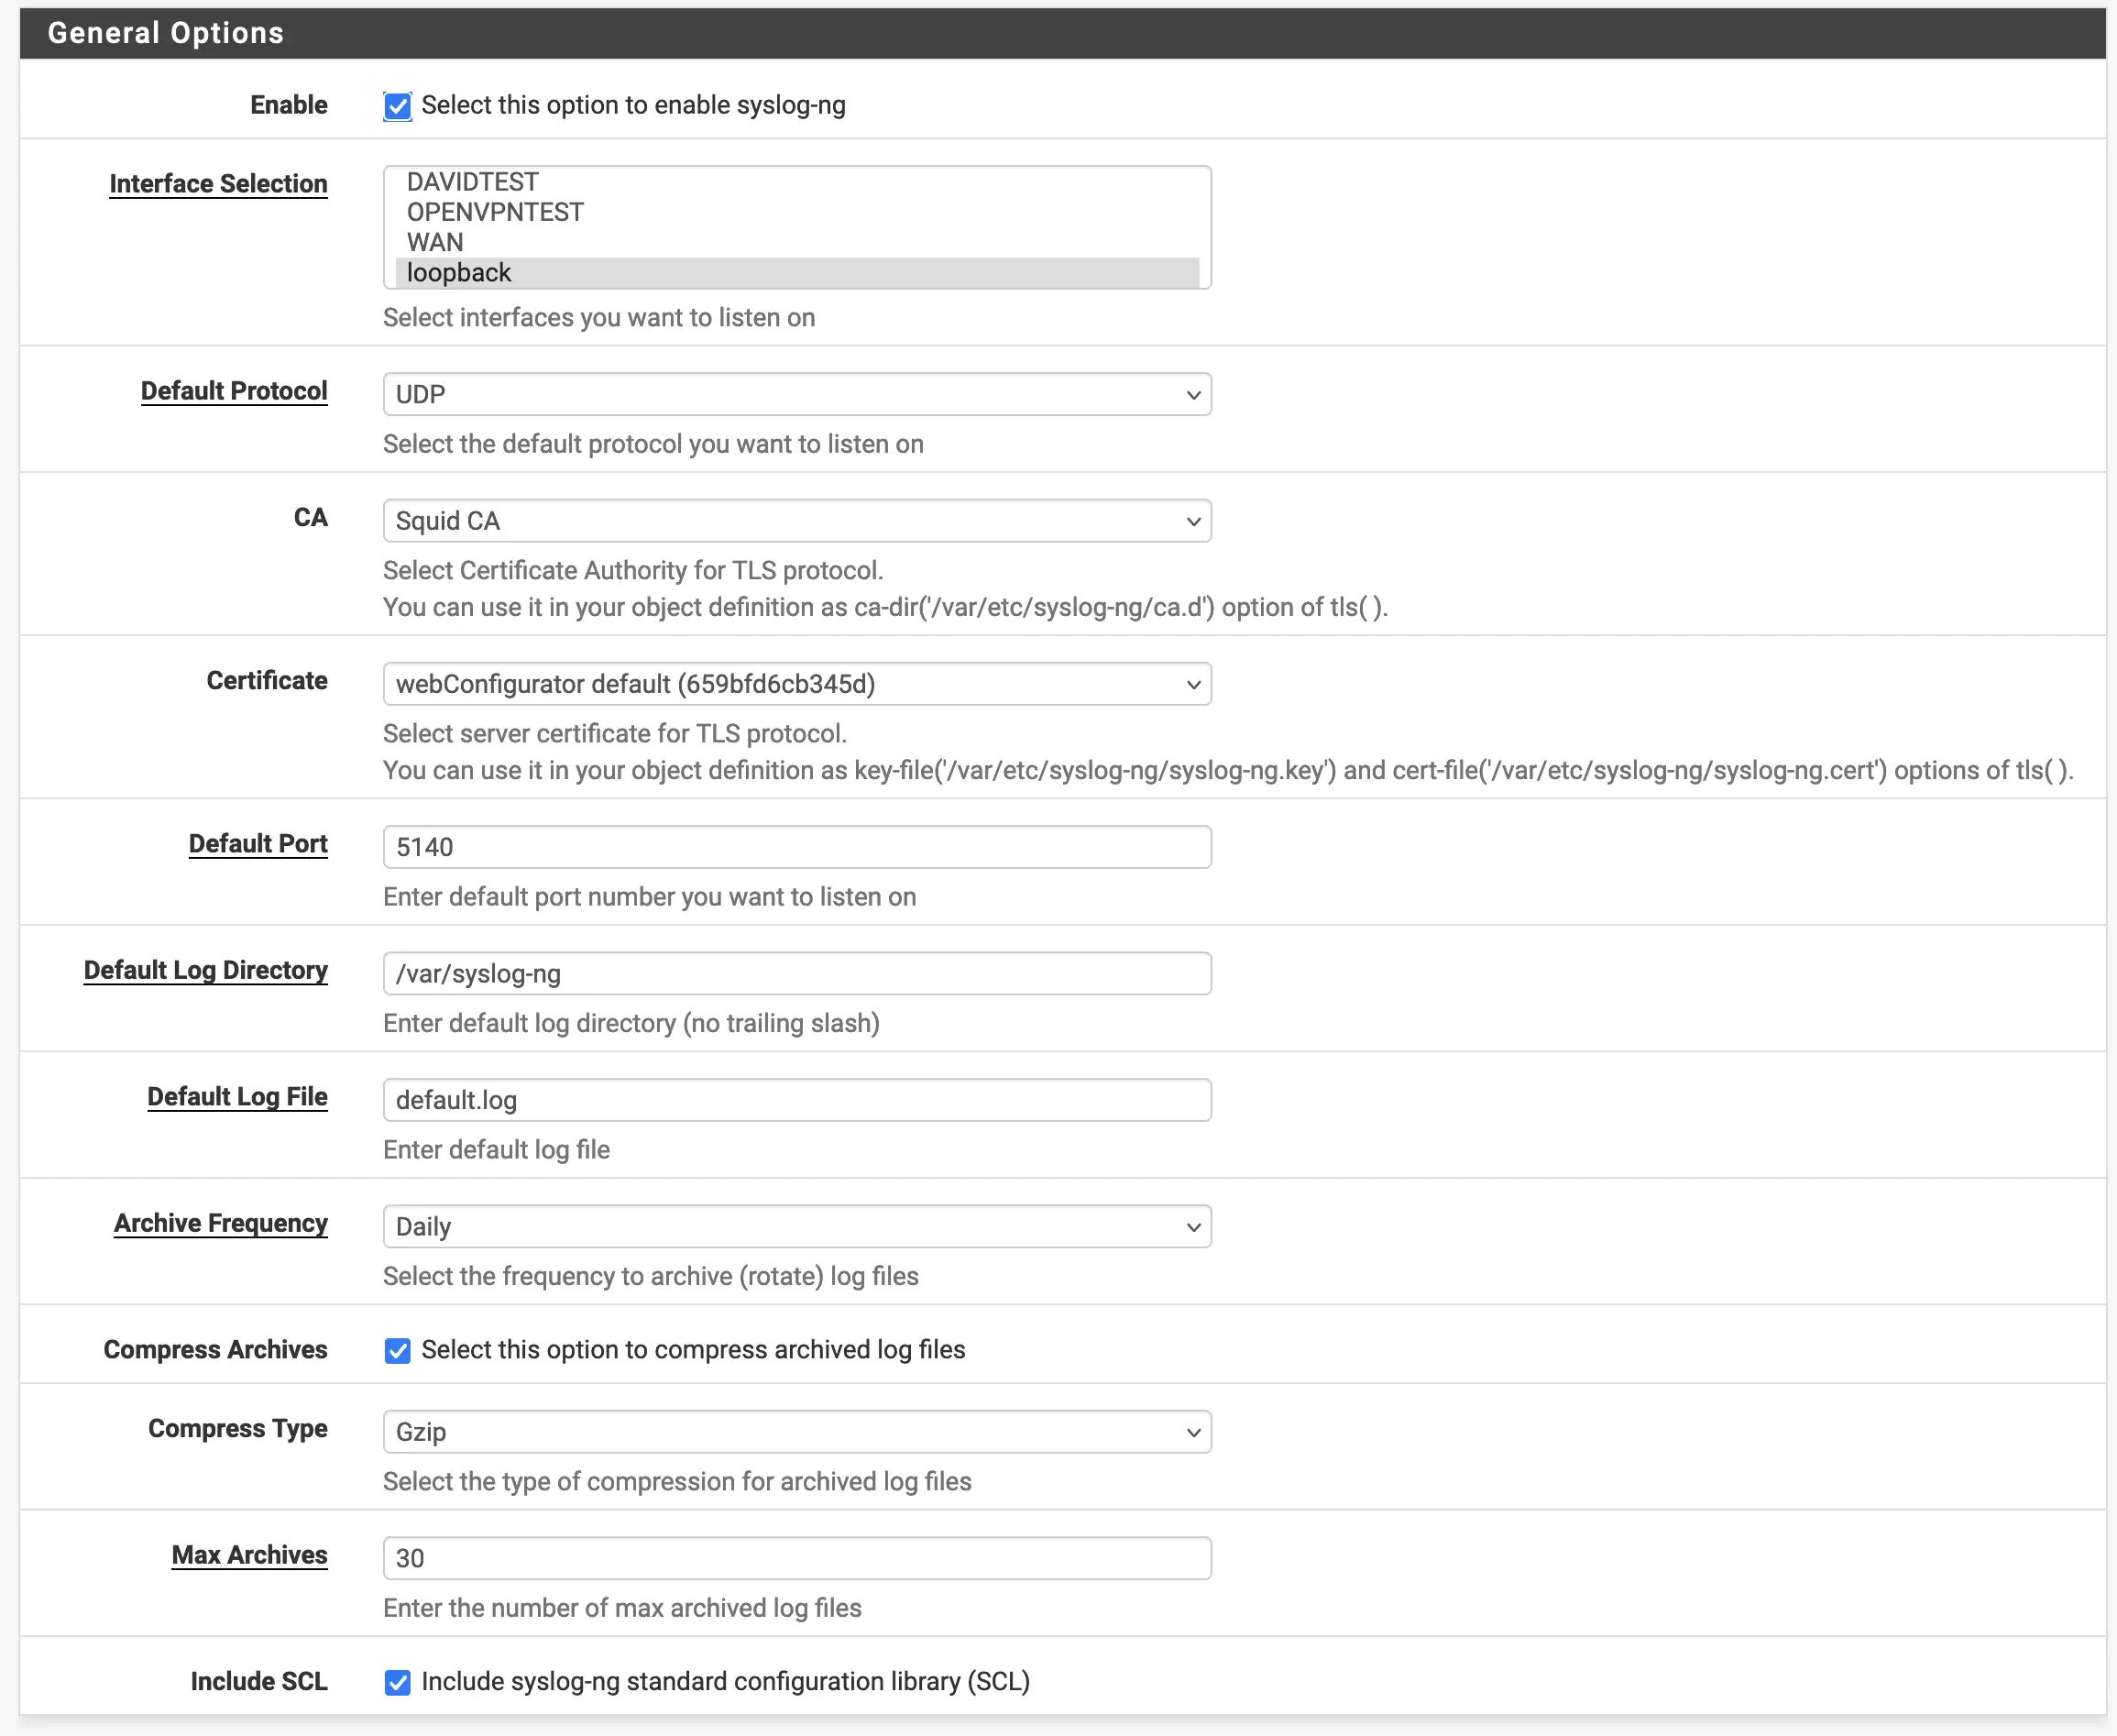
Click Save
Step 3: Configure pfSense Remote Logging
Enable Remote Syslog
Navigate to Status → System Logs → Settings tab
Configure remote logging:
| Setting | Value |
|---|---|
| Enable Remote Logging | ✓ Checked |
| Remote log servers | 192.168.1.50:5514 (Wazuh server IP) |
| Syslog format | RFC3164 (for Wazuh compatibility) |
| Send to all remote log servers | ✓ Checked |
| Filter log entries | Select desired log types |
Select Log Types to Forward
Enable the following log types for comprehensive security monitoring:
- ✓ System General Logs
- ✓ System Gateway Logs
- ✓ Filter Logs (firewall events - critical!)
- ✓ DNS Resolver Logs
- ✓ DHCP Logs
- ✓ VPN Logs (if using IPsec/OpenVPN)
- ✓ NTP Logs
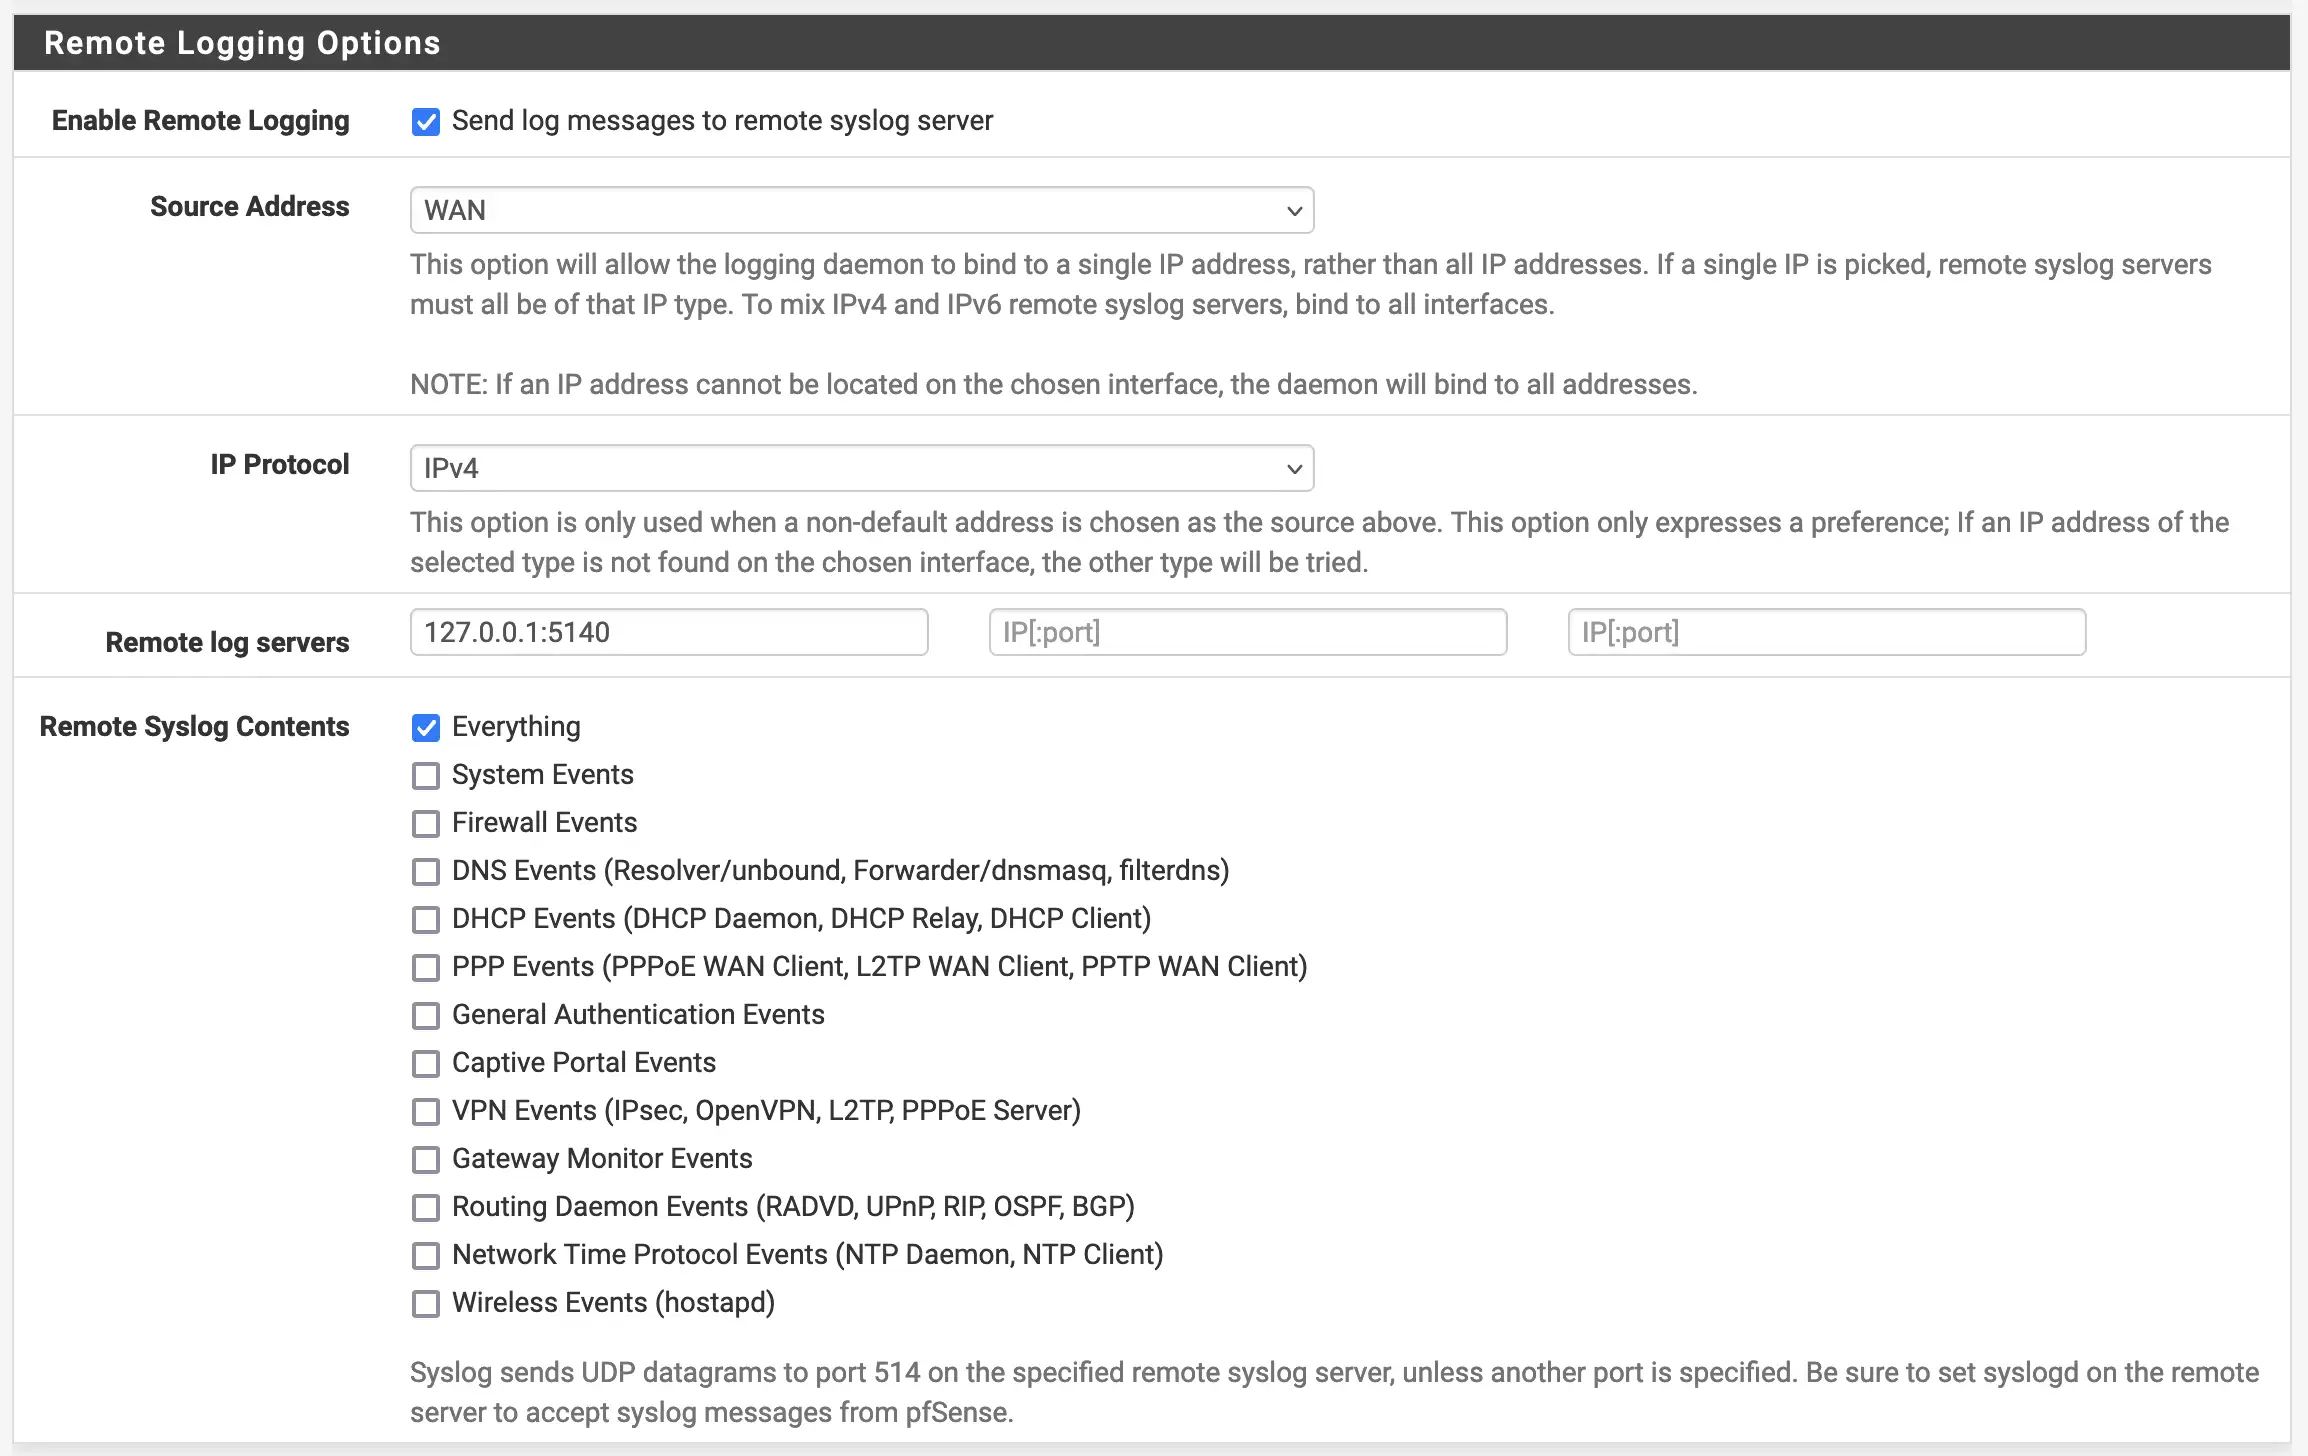
Click Save
Step 4: Configure Wazuh Manager
Edit ossec.conf
On the Wazuh Manager server, edit /var/ossec/etc/ossec.conf:
<ossec_config>
  <!-- pfSense syslog input -->
  <remote>
    <connection>syslog</connection>
    <port>5514</port>
    <protocol>udp</protocol>
    <allowed-ips>192.168.1.10</allowed-ips>
    <local_ip>192.168.1.50</local_ip>
  </remote>

  <!-- Optional: TCP input for reliability -->
  <remote>
    <connection>syslog</connection>
    <port>5514</port>
    <protocol>tcp</protocol>
    <allowed-ips>192.168.1.10</allowed-ips>
    <local_ip>192.168.1.50</local_ip>
  </remote>
</ossec_config>
Configuration Notes:
| Parameter | Description |
|---|---|
port |
Syslog port (5514 is non-standard, avoids conflicts) |
protocol |
UDP (standard) or TCP (more reliable) |
allowed-ips |
pfSense firewall IP address |
local_ip |
Wazuh Manager IP (if multi-homed) |
Restart Wazuh Manager
systemctl restart wazuh-manager
systemctl status wazuh-manager
Step 5: Configure syslog-ng Forwarding
Add Destination
Navigate to Services → syslog-ng → Advanced tab
Add a new destination entry:
| Field | Value |
|---|---|
| Type | destination |
| Name | DST_WAZUH_SYSLOG |
| Configuration | See below |
network("192.168.1.50" transport("udp") port(5514));
For TCP (more reliable):
network("192.168.1.50" transport("tcp") port(5514));
Add Log Path
Add a new log entry to connect source to destination:
| Field | Value |
|---|---|
| Type | log |
| Name | LOG_WAZUH_FORWARD |
| Configuration | See below |
log { source(_DEFAULT); destination(DST_WAZUH_SYSLOG); };
Optional: Rewrite Hostname
If hostname is not appearing correctly in Wazuh, add a rewrite rule:
| Field | Value |
|---|---|
| Type | rewrite |
| Name | REWRITE_HOSTNAME |
| Configuration | See below |
set("pfsense.mydomain.intra", value("HOST"));
Then modify the log path to include the rewrite:
log { source(_DEFAULT); rewrite(REWRITE_HOSTNAME); destination(DST_WAZUH_SYSLOG); };
Click Save and Apply Changes
Step 6: Verify Wazuh Decoders
Check Default pfSense Decoders
Wazuh includes built-in pfSense decoders. Verify they’re loaded:
# List pfSense decoders
grep -r "pfsense" /var/ossec/etc/decoders/

# Check decoder file
cat /var/ossec/etc/decoders/pfsense_decoders.xml
Test Log Parsing
# Use wazuh-logtest to verify parsing
/var/ossec/bin/wazuh-logtest

# Enter a sample pfSense log:
<14>Jan 15 10:30:45 pfsense.mydomain.intra filterlog: ...
Custom Decoders (If Needed)
If default decoders don’t parse your logs correctly, create custom decoders:
<!-- /var/ossec/etc/decoders/local_pfsense.xml -->
<decoder name="pfsense-custom">
    <program_name>pfsense</program_name>
</decoder>

<decoder name="pfsense-filterlog">
    <parent>pfsense-custom</parent>
    <prematch>filterlog:</prematch>
</decoder>
Step 7: Configure Wazuh Rules
Default pfSense Rules
Wazuh includes default rules for pfSense in /var/ossec/etc/rules/pfsense_rules.xml:
<!-- Sample rule for blocked traffic -->
<rule id="87100" level="3">
    <decoded_as>pfsense</decoded_as>
    <match>block</match>
    <description>pfSense: Firewall blocked connection</description>
</rule>
Custom Rules
Create custom rules for your security requirements:
<!-- /var/ossec/etc/rules/local_rules.xml -->
<group name="pfsense,firewall,">

    <!-- Critical: Multiple blocked connections from same IP -->
    <rule id="100100" level="10">
        <if_sid>87100</if_sid>
        <same_source_ip />
        <options>frequency=5</options>
        <timeframe>60</timeframe>
        <description>pfSense: Multiple blocked connections - possible scan</description>
    </rule>

    <!-- High: SSH brute force -->
    <rule id="100101" level="12">
        <if_sid>87100</if_sid>
        <match>port 22</match>
        <options>frequency=10</options>
        <timeframe>300</timeframe>
        <description>pfSense: Possible SSH brute force attack</description>
    </rule>

</group>
Step 8: Verify Log Reception
Check Wazuh Logs
# Monitor Wazuh logs
tail -f /var/ossec/logs/ossec.log | grep -i pfsense

# Check alerts
tail -f /var/ossec/logs/alerts/alerts.json | jq '.data.srcip' | sort | uniq -c
Verify in Wazuh Dashboard
- Navigate to Security events in Wazuh Dashboard
- Filter by agent:
pfsense - Verify firewall events are appearing
Test Firewall Log Generation
From a test machine, generate firewall logs:
# Port scan (will be blocked)
nmap -sS 192.168.1.1

# Check if logs appear in Wazuh
Advanced Configuration
Log Enrichment
Add GeoIP and threat intelligence enrichment:
<!-- In ossec.conf -->
<ossec_config>
    <ruleset>
        <rule_dir>ruleset/rules</rule_dir>
        <rule_exclude>0215-policy_rules.xml</rule_exclude>
        <decoder_dir>ruleset/decoders</decoder_dir>
        <decoder_exclude>decoders/aws.xml</decoder_exclude>
    </ruleset>
</ossec_config>
Alert Correlation
Configure alert correlation for threat detection:
<global>
    <white_list>127.0.0.1</white_list>
    <white_list>^localhost.localdomain$</white_list>

    <!-- Alert correlation -->
    <log_analysis>
        <max_eps>10000</max_eps>
    </log_analysis>
</global>
Integration with External Tools
<!-- Slack integration -->
<slack>
    <enabled>yes</enabled>
    <hook_url>https://hooks.slack.com/services/XXX/YYY/ZZZ</hook_url>
    <alert_level>10</alert_level>
</slack>

<!-- Email alerts -->
<email_alerts>
    <email_to>security@mydomain.intra</email_to>
    <rule_id>100100,100101</rule_id>
    <do_not_delay/>
</email_alerts>
Troubleshooting
Logs Not Appearing in Wazuh
Check connectivity:
# On pfSense
tcpdump -i any -n port 5514

# On Wazuh
tcpdump -i any -n port 5514
nc -ulvp 5514
Verify syslog-ng is running:
# On pfSense
ps aux | grep syslog-ng
Decoder Issues
Test log format:
# Check raw logs on Wazuh
tail -f /var/ossec/logs/archives/archives.log | grep pfsense

# Verify decoder matching
/var/ossec/bin/wazuh-logtest -f /var/ossec/logs/archives/archives.log
Performance Issues
If experiencing high log volume:
- Filter logs in pfSense before forwarding
- Use TCP with compression
- Increase Wazuh worker processes
- Consider log sampling for high-volume events
Security Best Practices
Network Security
- Dedicated Management VLAN: Place Wazuh and pfSense management on separate VLAN
- Firewall Rules: Restrict syslog traffic to specific IPs
- TLS Encryption: Use syslog-ng with TLS for log forwarding
Wazuh Hardening
# Secure Wazuh configuration
chown root:wazuh /var/ossec/etc/ossec.conf
chmod 640 /var/ossec/etc/ossec.conf

# Enable FIM on configuration files
<syscheck>
    <directories>/var/ossec/etc</directories>
</syscheck>
Log Retention
Configure appropriate log retention:
<alerts>
    <log_format>json</log_format>
    <rotation>
        <maximum>30</maximum>
        <unit>days</unit>
    </rotation>
</alerts>
Wazuh 4.8+ Features
New features in Wazuh 4.8+ for firewall monitoring:
- Enhanced GeoIP: More accurate IP geolocation
- MITRE ATT&CK Integration: Map firewall events to attack techniques
- Machine Learning: Anomaly detection for firewall traffic
- Improved Dashboards: Pre-built pfSense visualizations