Analyzing PFsense squid logs in Graylog
We will parse the access log records generated by PfSense and squid plugin. We already have our graylog server running and we will start preparing the terrain to capture those logs records.
Many thanks to opc40772 developed the original contantpack for pfsense squid log agregation what I updated for the new Graylog3 and Elasticsearch 6.
Celebro localinstall
# celebro van to use port 9000 so change graylog3 bindport
nano /etc/graylog/server/server.conf
http_bind_address = 127.0.0.1:9400
nano /etc/nginx/conf.d/graylog.conf

systemctl restart graylog-server.service
systemctl restart nginx

wget https://github.com/lmenezes/cerebro/releases/download/v0.8.3/cerebro-0.8.3-1.noarch.rpm
yum localinstall cerebro-0.8.3-1.noarch.rpm
Create indices
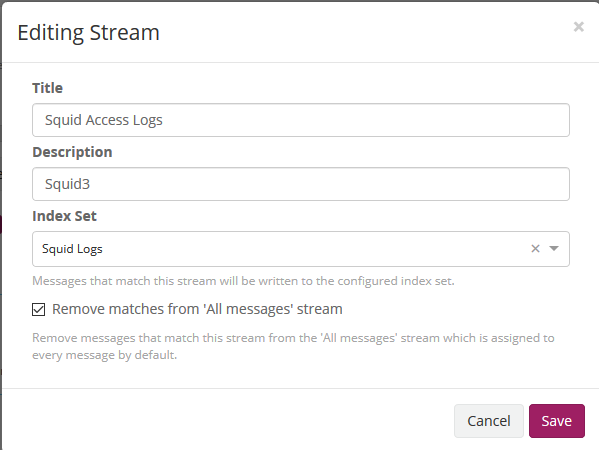
We now create the Pfsense indice on Graylog at System / Indexes

Import index template for elasticsearch 6.x
systemctl stop graylog-server.service
Go to celebro > more > index templates
Create new with name: pfsense-custom and copy the template from file squid_custom_template_el6.json
Edit other pfsense template to (sorrend 0)
In Cerebro we stand on top of the pfsense index and unfold the options and select delete index.
Geoip database
wget -t0 -c http://geolite.maxmind.com/download/geoip/database/GeoLite2-City.tar.gz
tar -xvf GeoLite2-City.tar.gz
cp GeoLite2-City_*/GeoLite2-City.mmdb /etc/graylog/server

systemctl start graylog-server.service
Enable geoip database at System \ Imput > Configurations > Plugins > Geo-Location Processor > update
Chane the order of the Message Processors Configuration
- AWS Instance Name Lookup
- Message Filter Chain
- Pipeline Processor
- GeoIP Resolver
Enable geoip database
Import contantpack
git clone https://github.com/devopstales/Squid-Graylog.git
import
chaneg date timezone in Pipeline rule
Go tu Stream menu and edit stream
System > Pipelines
Manage rules and then Edit rule (Change the timezone)
rule "timestamp_pfsense_for_grafana"
 when
 has_field("timestamp")
then
// the following date format assumes there's no time zone in the string
 let source_timestamp = parse_date(substring(to_string(now("Europe/Budapest")),0,23), "yyyy-MM-dd'T'HH:mm:ss.SSS");
 let dest_timestamp = format_date(source_timestamp,"yyyy-MM-dd HH:mm:ss");
 set_field("real_timestamp", dest_timestamp);
end
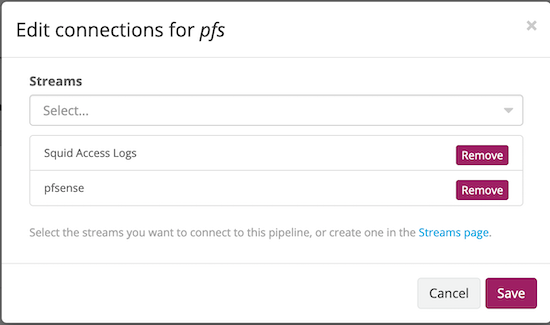
Add the existing pipeline to the squid stream by clicking the Edit connections at Pipeline connections.
Confifure pfsense
# http://pkg.freebsd.org/FreeBSD:11:amd64/latest/All/
pkg add http://pkg.freebsd.org/FreeBSD:11:amd64/latest/All/beats-6.7.1.txz

nano /usr/local/etc/filebeat.yml
filebeat.prospectors:
- input_type: log
  document_type: squid3
  paths:
    - /var/squid/logs/access.log

output.logstash:
  # The Logstash hosts
  hosts: ["192.168.0.112:5044"]

  # Optional SSL. By default is off.
  # List of root certificates for HTTPS server verifications
  bulk_max_size: 2048
 #ssl.certificate_authorities: ["/etc/filebeat/logstash.crt"]
  template.name: "filebeat"
  template.path: "filebeat.template.json"
  template.overwrite: false
  # Certificate for SSL client authentication
  #ssl.certificate: "/etc/pki/client/cert.pem"

  # Client Certificate Key
  #ssl.key: "/etc/pki/client/cert.key"

/usr/local/sbin/filebeat -c /usr/local/etc/filebeat.yml test config
cp /usr/local/etc/rc.d/filebeat /usr/local/etc/rc.d/filebeat.sh
echo "filebeat_enable=yes" >> /etc/rc.conf.local
echo "filebeat_conf=/usr/local/etc/filebeat.yml" >> /etc/rc.conf.local

/usr/local/etc/rc.d/filebeat.sh start
ps aux | grep beat
Install grafana Dashboard
# install nececery plugins
grafana-cli plugins install grafana-piechart-panel
grafana-cli plugins install grafana-worldmap-panel
grafana-cli plugins install savantly-heatmap-panel
grafana-cli plugins install briangann-datatable-panel
systemctl restart grafana-server
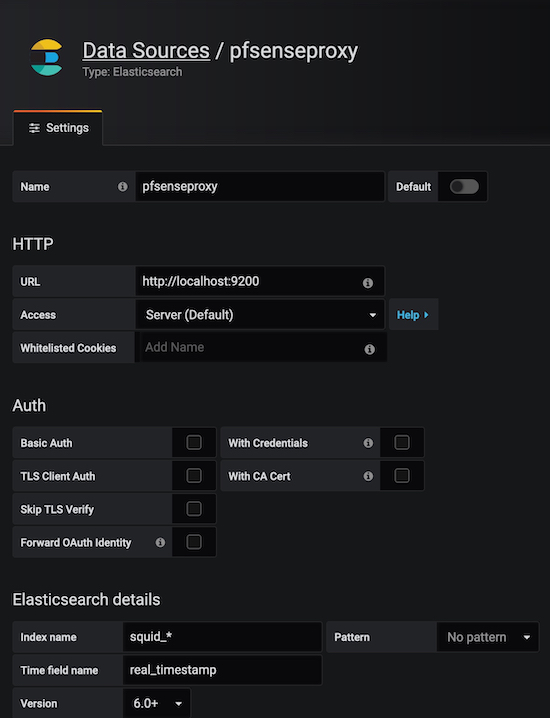
Create new datasource:
Import dashboadr.