Integrating OpenShift 4 with External Grafana
In this Post I will show you how you how you can integrate an external Grafana with OpenShift 4 Prometheus.
OpenShift already has its built-in monitoring stack with Prometheus, Grafana, and Alertmanager. It’s useful for monitoring a single cluster, but in the case of multiple clusters, you may want to get a single point of view. So I will configure an external VM based installed Grafana to get graphs from all the clusters.
Configuring OpenShift Prometheus
First we will create a a secret in Openshift for the authentication based in the name of the monitoring service account:
oc apply -f - <<EOF
apiVersion: v1
kind: Secret
metadata:
  name: prometheus-robot-secret
  namespace: openshift-monitoring
  annotations:
    kubernetes.io/service-account.name: prometheus-k8s
type: kubernetes.io/service-account-token
EOF
Check the token string and Try to query the OpenShift Prometheus using that token
TOKEN=`oc -n openshift-monitoring extract secret/prometheus-robot-secret --to=- --keys=token`

PROMETHEUS_URL=$(oc get route -n openshift-monitoring prometheus-k8s -o jsonpath="{.status.ingress[0].host}")

curl -sk -H "Authorization: Bearer $TOKEN" https://$PROMETHEUS_URL/api/v1/alerts
The result will end up with something like this:
{"status":"success","data":{"alerts":[{"labels":{"alertname":"PodDisruptionBudgetAtLimit" …
Integrate Grafana with OpenShift Prometheus
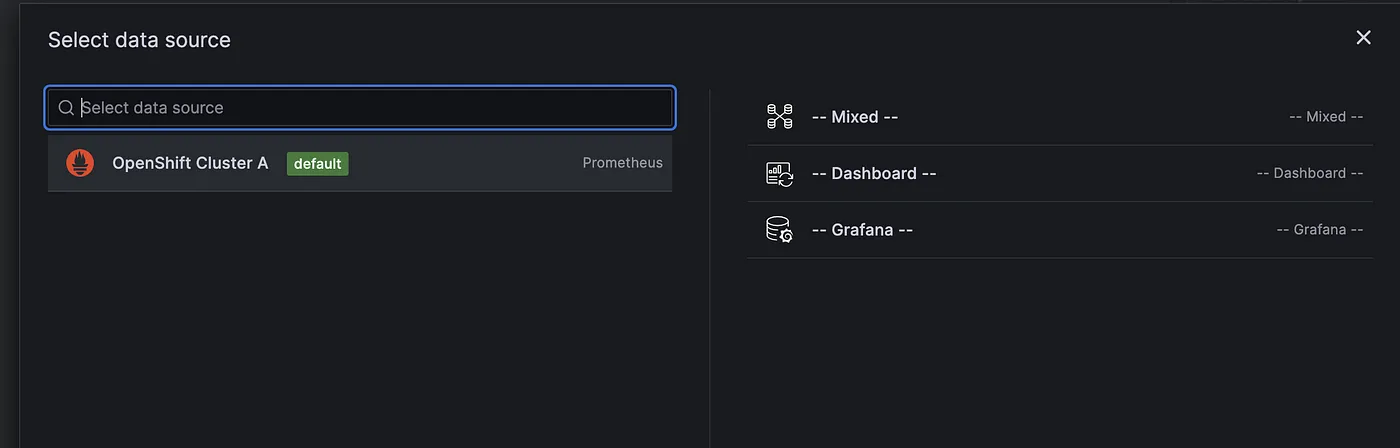
Go back to the Grafana Dashboard, and add ‘‘‘data source’’’ by go to ‘‘‘menu’’’ → ‘‘‘connection’’’ → ‘‘‘data source’’’ → add ‘‘‘new data source’’’ and choose ‘‘‘Prometheus’'’.
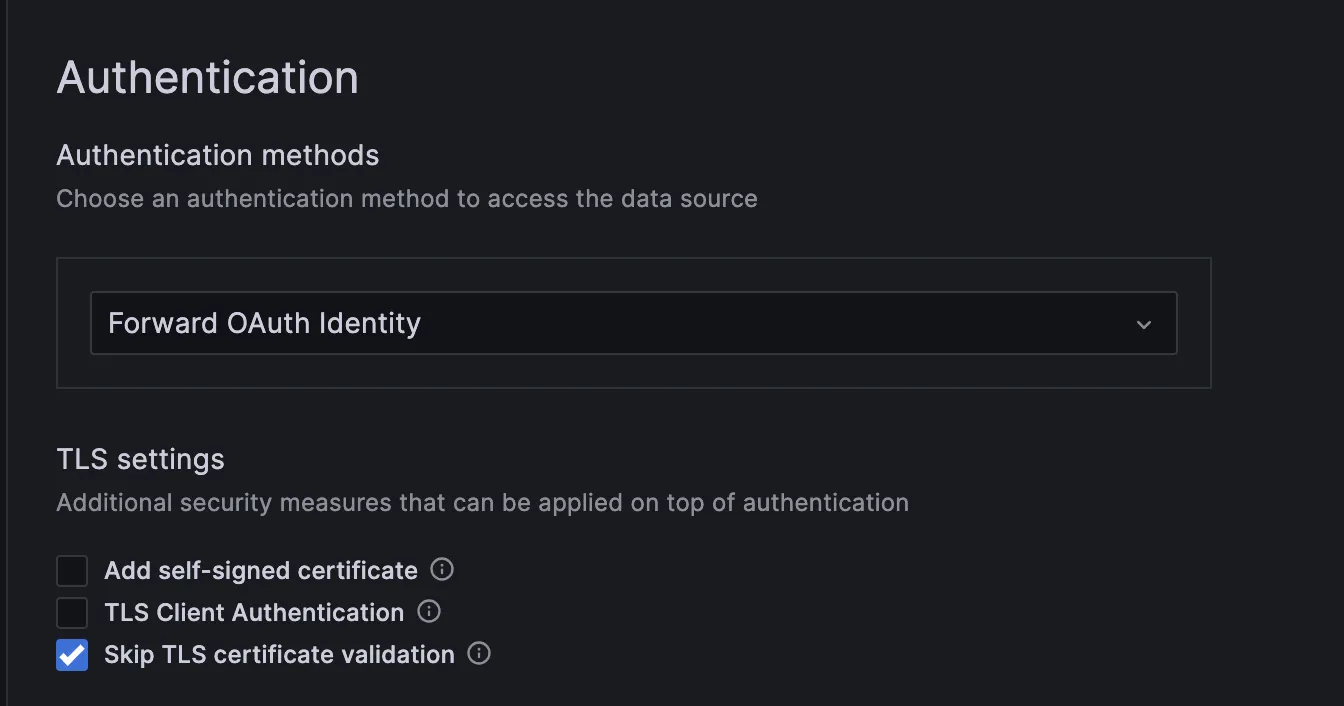
On Authentication:
- Choose Forward OAuth Identity as the authentication method
- Skip TLS Certificate Validation when using untrusted certificate
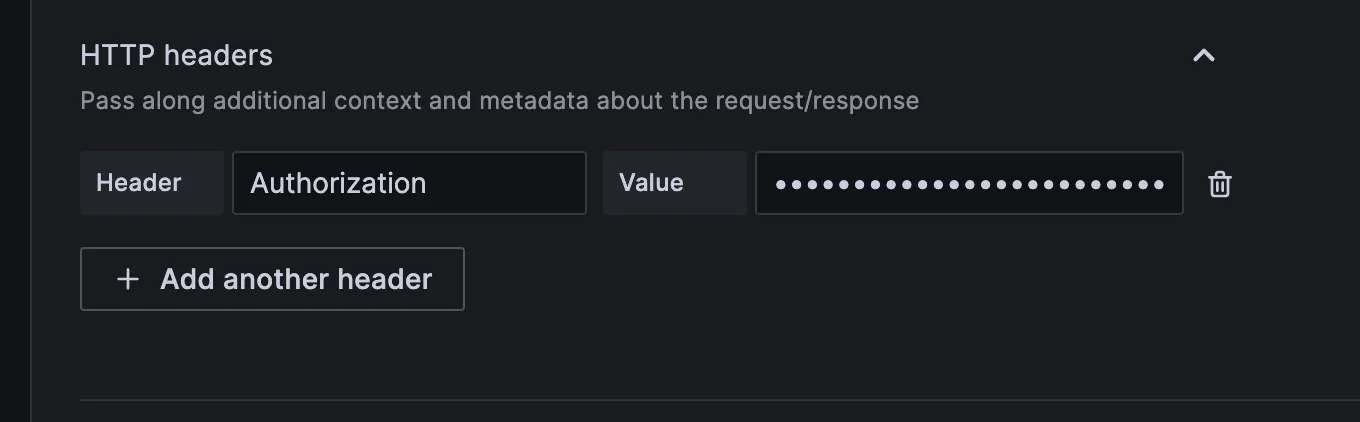
On HTTP Headers, add Header:
- Fill in the Header with ‘‘‘Authorization’’’
- Fill in the value with the output of this following command
TOKEN= `oc -n openshift-monitoring extract secret/prometheus-robot-secret — to=- — keys=token`
echo "Bearer $TOKEN"
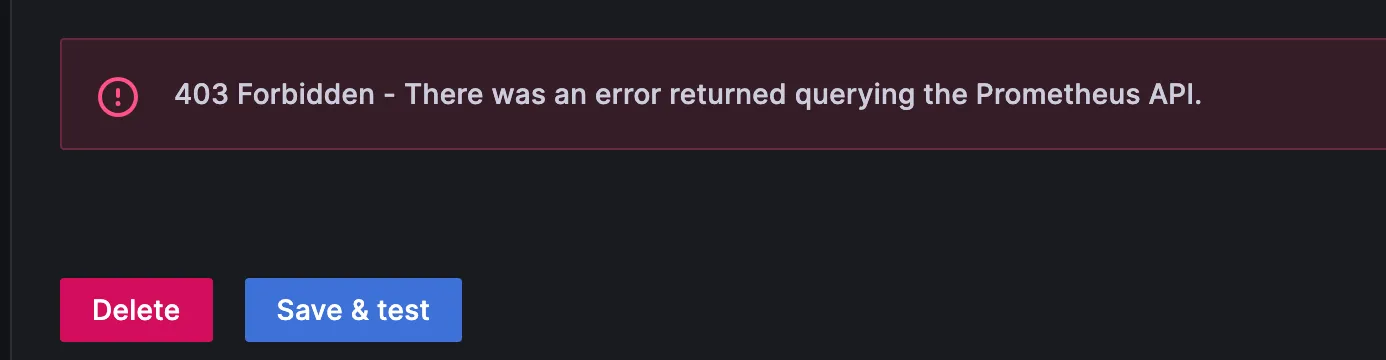
Click Save and Test, if there is an error it will be showing the error
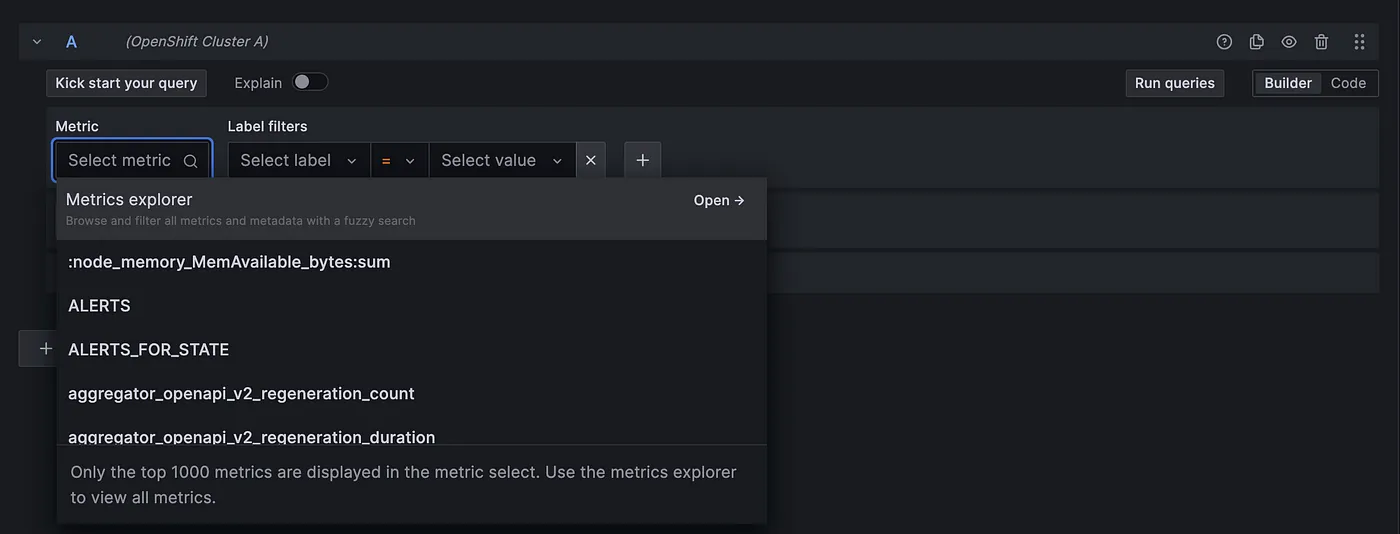
If everything goes well, we can start building Grafana dashboard

Click on building the dashboard, and choose the previous data source