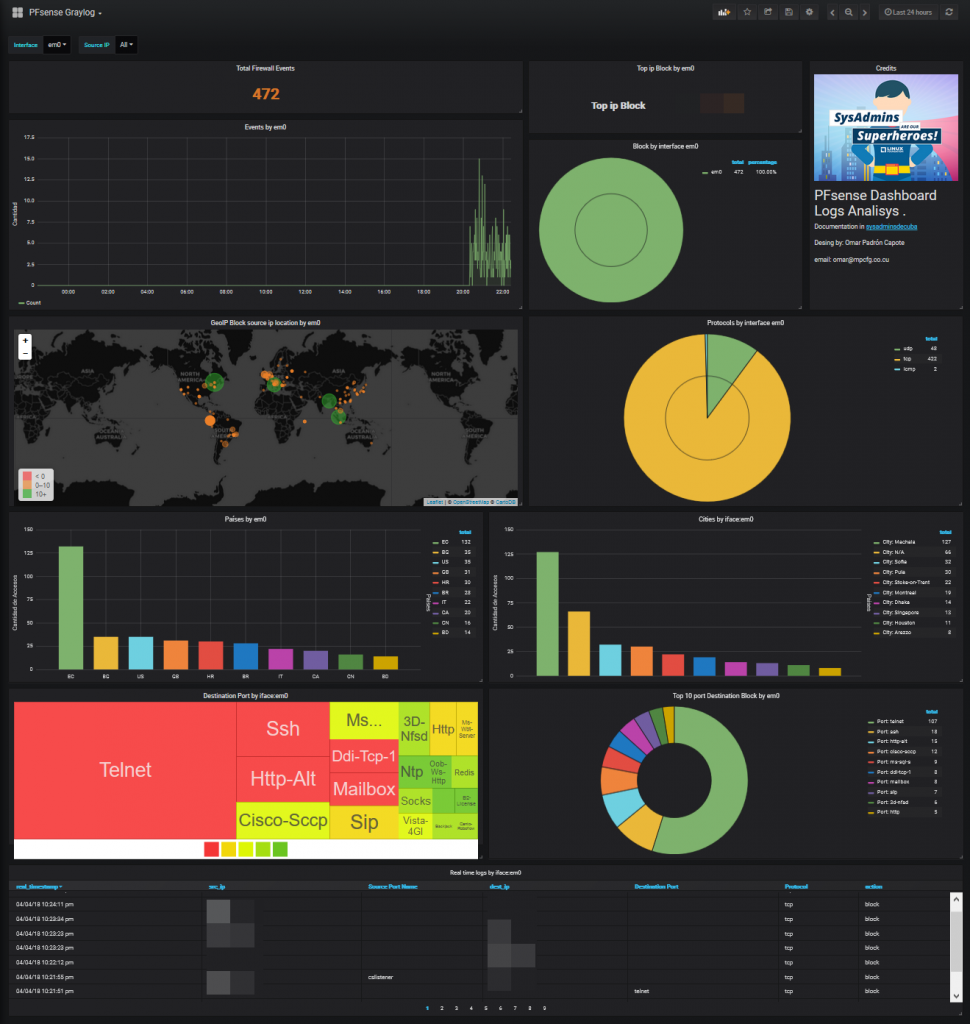
Analyzing PFsense logs in Graylog5
We will parse the log records generated by the PfSense Firewall. We already have our graylog server running and we will start preparing the terrain to capture those logs records.
Many thanks to opc40772 developed the original contantpack for pfsense log agregation what I updated for the new Graylog4 and Elasticsearch 7.
Celebro localinstall
# celebro van to use port 9000 so change graylog3 bindport
nano /etc/graylog/server/server.conf
http_bind_address = 127.0.0.1:9400
nano /etc/nginx/conf.d/graylog.conf

systemctl restart graylog-server.service
systemctl restart nginx

yum install -y https://github.com/lmenezes/cerebro/releases/download/v0.9.4/cerebro-0.9.4-1.noarch.rpm

sudo sed -i 's|# JAVA_OPTS="-Dpidfile.path=/var/run/cerebro/play.pid"|JAVA_OPTS="-Dpidfile.path=/var/run/cerebro/play.pid -Dhttp.address=127.0.0.1 --add-opens java.base/java.lang=ALL-UNNAMED --add-opens java.base/sun.net.www.protocol.file=ALL-UNNAMED"|' /etc/default/cerebro

chown cerebro:cerebro -R /usr/share/cerebro
nano /etc/cerebro/application.conf
hosts = [
  {
    host = "http://127.0.0.1:9200"
    name = "OpenSearch"
    auth = {
      username = "admin"
      password = "admin"
    }
  }
]
systemctl restart cerebro
systemctl enable cerebro
systemctl status cerebro
echo 'server {
  listen *:80;
  server_name cerebro.mydomain.intra;

  location / {
    proxy_pass      http://127.0.0.1:9000;
   proxy_set_header Host $host;
   proxy_set_header X-Real-IP $remote_addr;
   proxy_set_header X-Forwarded-Host $host;
   proxy_set_header X-Forwarded-Server $host;
   proxy_set_header X-Forwarded-For $proxy_add_x_forwarded_for;
  }
}' > /etc/nginx/conf.d/cerebro.conf
nginx -t && systemctl restart nginx
Create indices
We now create the Pfsense indice on Graylog at System / Indexes
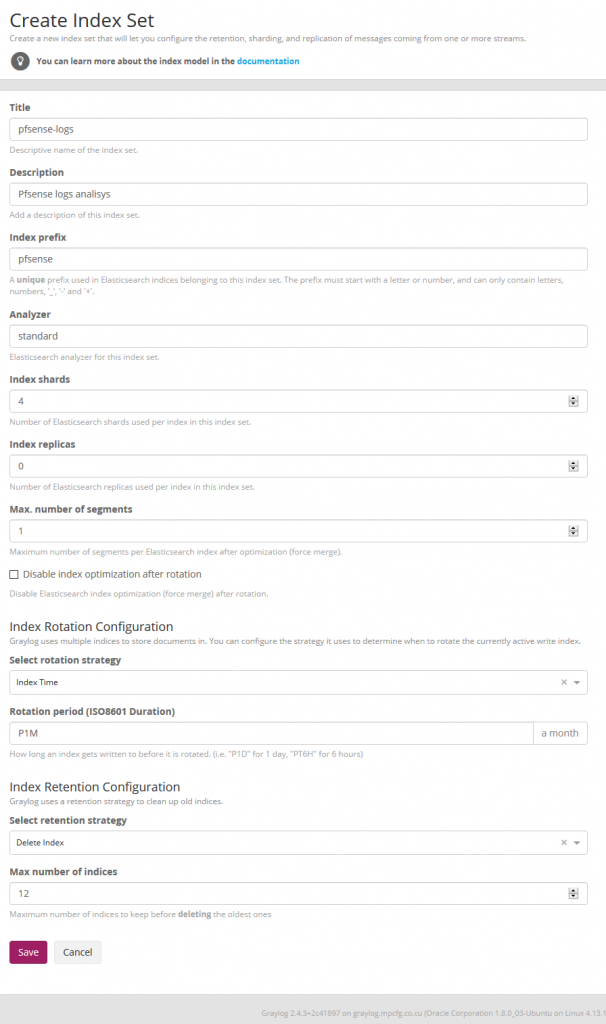
Import index template for elasticsearch 7.x
Go to celebro > more > index templates
Create new with name: pfsense-custom and copy the template from file pfsense_custom_template_es7.json
In Cerebro we stand on top of the pfsense index and unfold the options and select delete index.
systemctl stop graylog-server.service

git clone https://github.com/devopstales/pfsense-graylog.git
cd pfsense-graylog/service-names-port-numbers/
cp service-names-port-numbers.csv /etc/graylog/server/
Geoip database
# go to https://dev.maxmind.com/geoip/geoip2/geolite2/ and download
# or use an old one
cd /etc/graylog/server
wget https://github.com/socfortress/Wazuh-Rules/releases/download/1.0/GeoLite2-City.mmdb
wget https://github.com/socfortress/Wazuh-Rules/releases/download/1.0/GeoLite2-ASN.mmdb

systemctl start graylog-server.service
Enable Threat Intelligence database at System > Configurations > Plugins > Threat Intelligence Lookup Configuration
Click Edit Configuration than enable Allow Tor exit node lookups? and Allow Spamhaus DROP/EDROP lookups?
Enable geoip database at System > Configurations > Plugins > Geo-Location Processor
Click Edit Configuration than enable Enable Geo-Location processor
Chane the order of the Message Processors Configuration
- AWS Instance Name Lookup
- Message Filter Chain
- Pipeline Processor
- Stream Rule Processor
- GeoIP Resolver
Import contantpack
- Import contantpack at
System > Content Packs- install
Open Threat Exchange - Threat Intel Plugin - install
Spamhaus DROP - Threat Intel Plugin - install
Whois - Threat Intel Plugin - selact
upload
- install
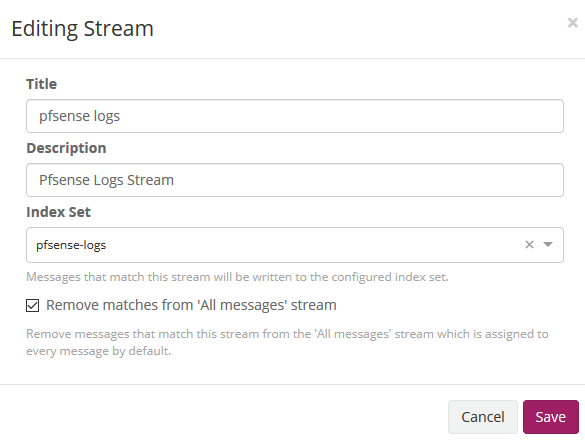
Go tu Stream menu and edit stream
Confifure pfsense
Status > System Logs > Settings
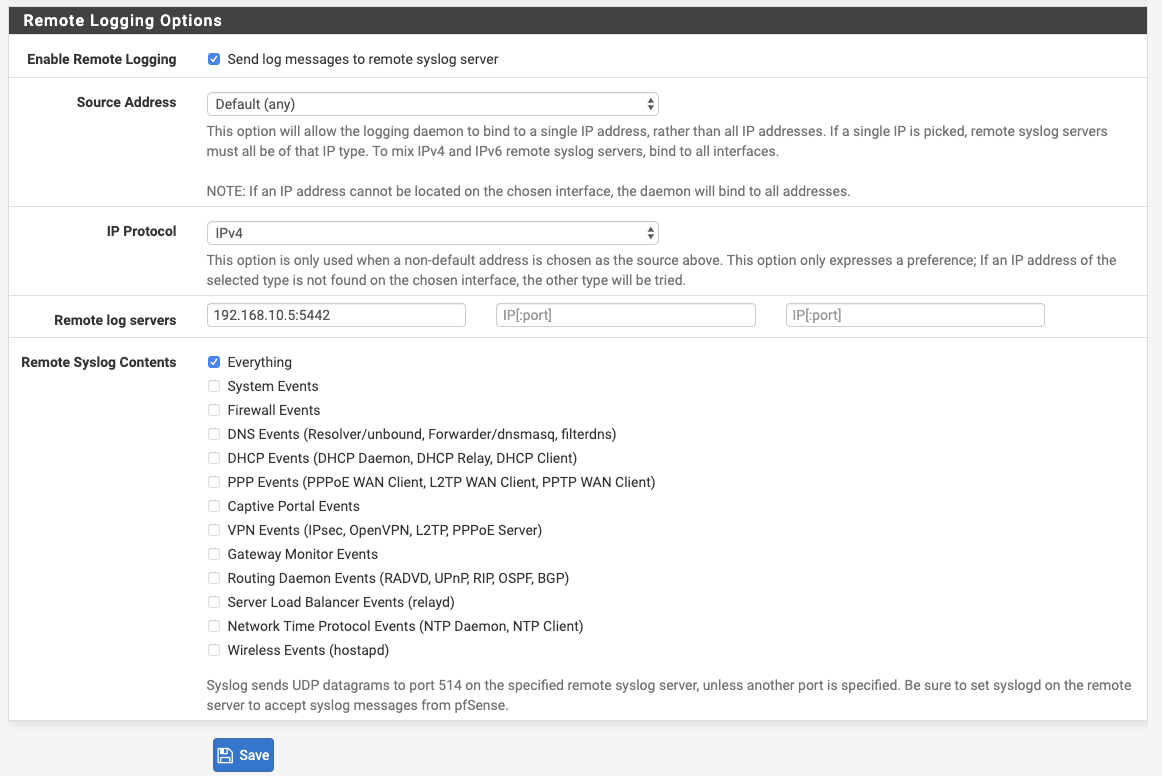
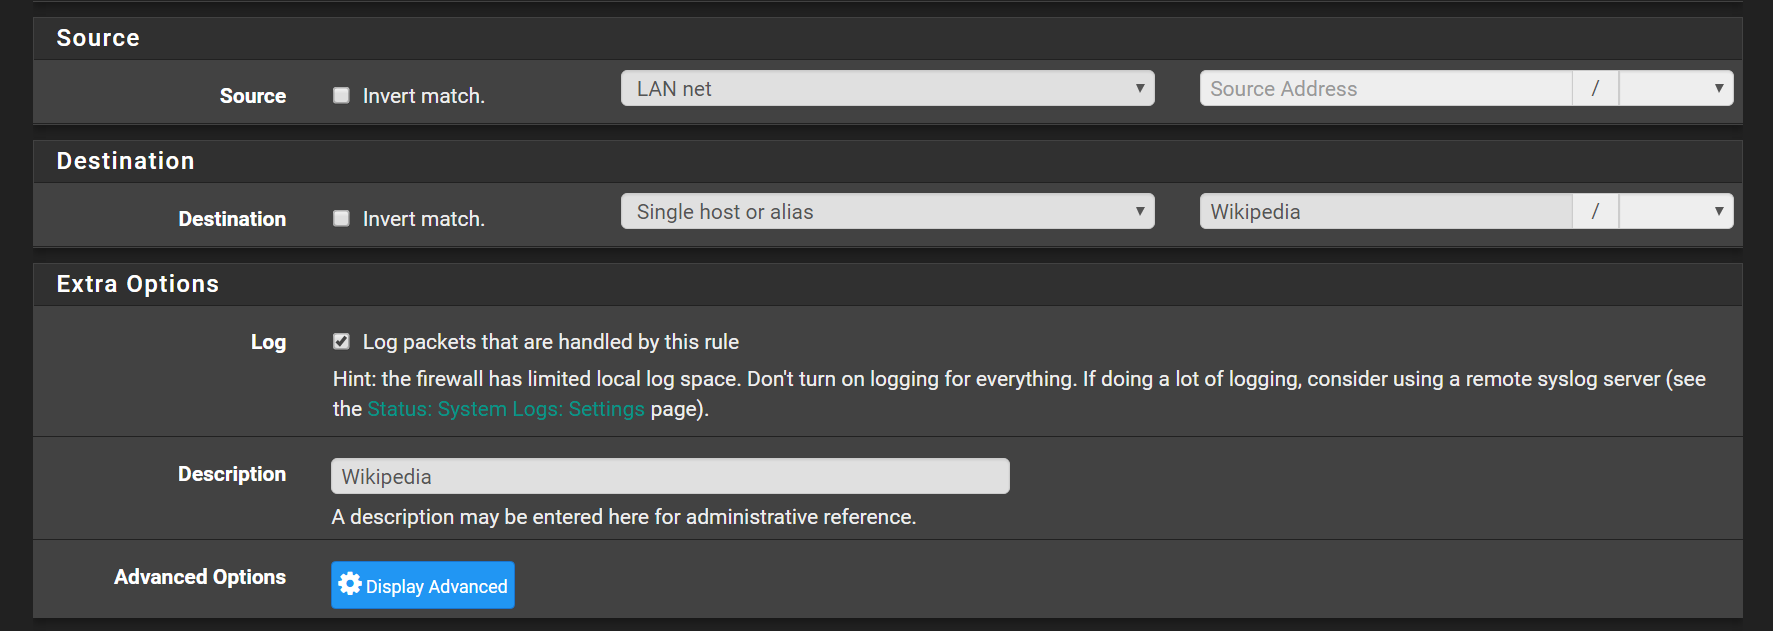
Enable logging on rule: Go to Firewall > Rules and tick Log packets that are handled by this rule
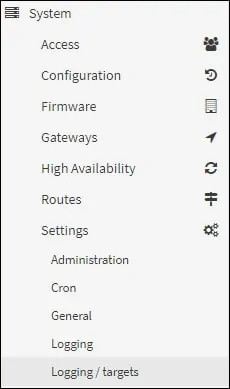
Confifure Opnsense
Access the Opnsense GUI
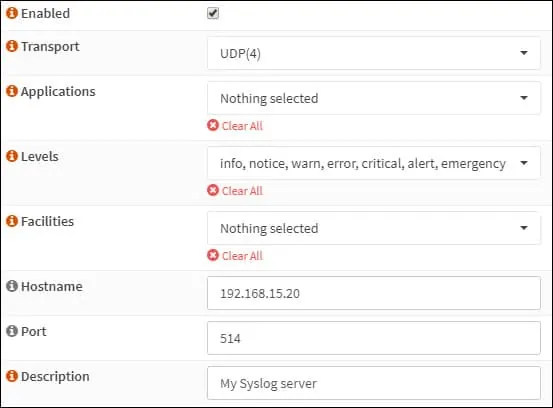
System menu, access the Settings sub-menu and select the Logging / Targets option.
Add a new logging target and perform the following configuration:
Install grafana Dashboard
# install nececery plugins
grafana-cli plugins install grafana-piechart-panel
grafana-cli plugins install grafana-worldmap-panel
grafana-cli plugins install savantly-heatmap-panel
systemctl restart grafana-server
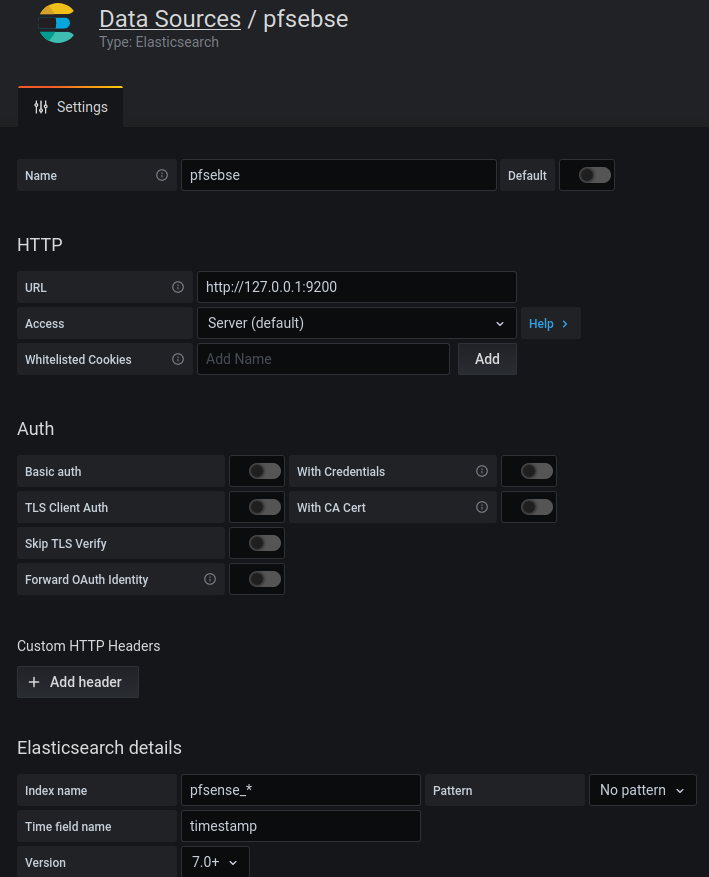
Create new datasource:
Import dashboadr from store: id: 5420