How to Manage Kubernetes Resource Limits
In this post I will show you the usage of the Kubernetes limits and requests.
Kubernetes schedule and orchestrate containers on the underlying shared set of physical resources. By default, a pod in Kubernetes will run with no limits on CPU and memory in a namespace. However, this can create several problems related to resources. So there is no control of how much resources each pod can use. Some a hungry container can eat the resources from other container on the node.
Resource types
CPU and memory are each a resource type. Every resource type has a base unit. CPU represents compute processing and is specified in units of CPU cores. 1 physical CPU core, or 1 virtual core, depending on whether the node is a physical host or a virtual machine running inside a physical machine. You can use a fraction of a cpu by setting to 0.5 For CPU resource units, the quantity expression 0.1 is equivalent to the expression 100m, which can be read as “one hundred millicpu”.
The other common resource is memory. Memory is specified in units of bytes. You can express memory as a plain integer or as a fixed-point number using one of these quantity suffixes: E, P, T, G, M, k or Ei, Pi, Ti, Gi, Mi, Ki. For example, the following represent roughly the same value:
128974848, 129e6, 129M, 128974848000m, 123Mi
Understanding Requests
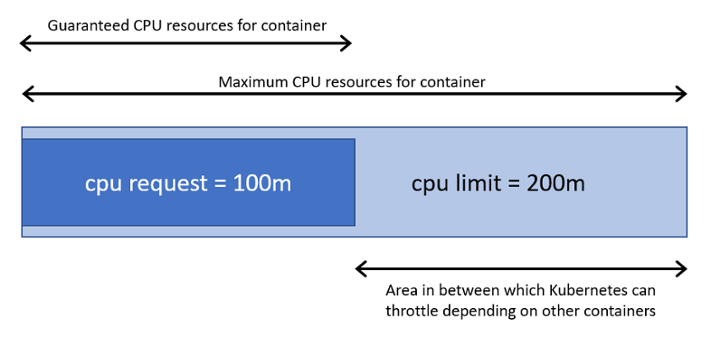
A request is the amount of resources that the system will guarantee for the container. Kubernetes will use this value to decide on which node to place the pod. In the case that request is not set for a container, the defaults is the same as the resource limit. The Kubelet reserves the requested amount of system resource. That means no mather the container use the requested resource or not other containers can not use that reserved resources.
Understanding Limits
A limit is the maximum amount of resources that Kubernetes will allow the container to use. For example: when a process in the container tries to consume more than the allowed amount of memory, the system kernel terminates the process that attempted the allocation, with an out of memory (OOM) error. If limit is not set, then the default is to set 0 (unbounded).
Examples
Below is an example of a pod configuration file with requests and limits set for CPU and memory of two containers in a pod.
apiVersion: v1
kind: Pod
metadata:
  name: demo
spec:
  containers:
  - name: demo1
    image: nginx
    resources:
      requests:
        memory: "16Mi"
        cpu: "100m"
      limits:
        memory: "32Mi"
        cpu: "200m"
  - name: demo2
    image: mysql
    resources:
      requests:
        memory: "64Mi"
        cpu: "200m"
      limits:
        memory: "128Mi"
        cpu: "400m"
Run the following command to inspect the resources used by the pod:
$ kubectl top pods
NAME          CPU(cores)   MEMORY(bytes)
demo          201m         27Mi
You can do a similar test for nodes or namespaces:
$ kubectl top node

NAME                         CPU(cores)   CPU%   MEMORY(bytes)   MEMORY%
k8s-m101                     1338m        66%    3586Mi          45%
k8s-w102                     2488m        31%    18918Mi         58%
Yo can use a handy tool called kube-capacity that provides an overview of the resource requests, limits, and utilization in a Kubernetes cluster:
kubectl krew install resource-capacity
$ kube-capacity

NODE        CPU REQUESTS    CPU LIMITS    MEMORY REQUESTS    MEMORY LIMITS
*           560m (28%)      130m (7%)     572Mi (9%)         770Mi (13%)
k8s-m101    220m (22%)      10m (1%)      192Mi (6%)         360Mi (12%)
k8s-w102    340m (34%)      120m (12%)    380Mi (13%)        410Mi (14%)
Finding the right requests and limits
For this demo I will use a Python app using the Flask framework. A simple cache service which has two endpoints, one to cache the data and another for retrieving it.
Before you start, make sure that your cluster has the metrics server installed. In my case I use minikube and I can enable it as a plugin:
$ minikube addons enable metrics-server
You can deploy the application with the following YAML file:
nano deployment.yaml
---
apiVersion: apps/v1
kind: Deployment
metadata:
  name: flask-cache
spec:
  replicas: 1
  selector:
    matchLabels:
      name: flask-cache
  template:
    metadata:
      labels:
        name: flask-cache
    spec:
      containers:
        - name: cache-service
          image: xasag94215/flask-cache
          ports:
            - containerPort: 5000
              name: rest
---
apiVersion: v1
kind: Service
metadata:
  name: flask-cache
spec:
  selector:
    name: flask-cache
  ports:
    - port: 80
      targetPort: 5000
---
apiVersion: networking.k8s.io/v1
kind: Ingress
metadata:
  name: flask-cache
spec:
  rules:
  - host: limit-demo.mydomain.intra
    http:
      paths:
      - backend:
          service:
            name: flask-cache
            port:
              number: 80
        path: /
        pathType: Prefix
$ kubectl top pods

NAME                           CPU(cores)   MEMORY(bytes)
flask-cache-8484fd74dd-sxpk7   188m         151Mi
Requests and limits depend on how much memory and CPU the application uses. An application that serves static pages might have a memory and CPU mostly static. It is common o have metrics server and prometheus database to store your metrics. The you can get max and min of the CPU and memory and extrapolate requests and limits. But there’s a quicker way.
Vertical Pod Autoscaler
The SIG-autoscaling group developed a tool that can do that automatically: the Vertical Pod Autoscaler (VPA). The Vertical Pod Autoscaler is a Kubernetes Operator that estimates the correct requests and limits for Pod.
Limitations:
- Vertical Pod autoscaling supports a maximum of 500 VerticalPodAutoscaler objects per cluster.
- Vertical Pod autoscaling is not ready for use with JVM-based workloads due to limited visibility into actual memory usage of the workload.
helm repo add fairwinds-stable https://charts.fairwinds.com/stable
helm upgrade --install vpa fairwinds-stable/vpa \
--namespace vpa-system --create-namespace \
--set admissionController.enabled=true \
--set updater.extraArgs.min-replicas=1
So if you want to the Vertical Pod Autoscaler (VPA) to estimate limits and requests for your Flask app, you should create the following YAML file:
nano vpa.yaml
---
apiVersion: "autoscaling.k8s.io/v1"
kind: VerticalPodAutoscaler
metadata:
  name: flask-cache
spec:
  targetRef:
    apiVersion: "apps/v1"
    kind: Deployment
    name: flask-cache
  updatePolicy:
    updateMode: "Off"
You can query the vpa object with:
$ kubectl describe vpa flask-cache
...
Status:
  Conditions:
    Last Transition Time:  2022-11-14T13:58:08Z
    Status:                True
    Type:                  RecommendationProvided
  Recommendation:
    Container Recommendations:
      Container Name:  cache-service
      Lower Bound:
        Cpu:     25m
        Memory:  60194k
      Target:
        Cpu:     410m
        Memory:  262144k
      Uncapped Target:
        Cpu:     410m
        Memory:  262144k
      Upper Bound:
        Cpu:     1
        Memory:  500Mi
Events:          <none>
In the lower part of the output, the autoscaler has three sections:
- The lower bound is the minimum estimation for the container.
- The upper bound is the maximum recommended resource estimation for the container.
- Target estimation is the one we will use for setting resource requests.
- All of these estimations are capped based on min allowed and max allowed container policies.
- The uncapped target estimation is a target estimation produced if there were no minAllowed and maxAllowed restrictions.
You can start a load tester and keep inspecting the Vertical Pod Autoscaler (VPA) recommendation. Once the recommendations are stable, you can apply them back to your deployment:
apiVersion: apps/v1
kind: Deployment
metadata:
  name: flask-cache
spec:
  replicas: 1
  selector:
    matchLabels:
      name: flask-cache
  template:
    metadata:
      labels:
        name: flask-cache
    spec:
      containers:
        - name: cache-service
          image: xasag94215/flask-cache
          ports:
            - containerPort: 5000
              name: rest
            resources:
              requests:
                cpu: 25m
                memory: 64Mi
              limits:
                cpu: 410m
                memory: 512Mi
If updateMode: "Auto" is set then the VerticalPodAutoscaler automatically patch the pod at next creation.
nano vpa.yaml
---
apiVersion: "autoscaling.k8s.io/v1"
kind: VerticalPodAutoscaler
metadata:
  name: flask-cache
spec:
  targetRef:
    apiVersion: "apps/v1"
    kind: Deployment
    name: flask-cache
  updatePolicy:
    updateMode: "Auto"
kubectl delete po flask-cache-8484fd74dd-hpmhh --force

kubectl get po -o yaml flask-cache-8484fd74dd-cdxkn | grep vpa
    vpaObservedContainers: cache-service
    vpaUpdates: 'Pod resources updated by flask-cache: container 0: cpu request, memory
kubectl get po -o yaml flask-cache-8484fd74dd-cdxkn
...
spec:
  containers:
  - image: xasag94215/flask-cache
    imagePullPolicy: Always
    name: cache-service
    ports:
    - containerPort: 5000
      name: rest
      protocol: TCP
    resources:
      requests:
        cpu: 350m
        memory: "248153480"
Visualising limits and requests recommendations
If you prefer to use a graphical interface to inspect VPA you can use Goldilocks dashboard
nano goldilocks-values.yaml
dashboard:
  ingress:
    enabled: true
    hosts:
      - host: goldilocks.mydomain.intra
        paths:
          - path: "/"
            type: "ImplementationSpecific"
---
helm upgrade --install goldilocks --namespace vpa-system fairwinds-stable/goldilocks -f goldilocks-values.yaml

kubectl label ns goldilocks goldilocks.fairwinds.com/enabled=true
If you want Goldilocks to display Vertical Pod Autoscaler (VPA) recommendations, you should tag the namespace with a particular label:
kubectl label namespace default goldilocks.fairwinds.com/enabled=true